
Interactive Video Wall Market Growth, Share & Trends by 2034
Coverage: By Types (Custom Layout, Standard Layout, Landscape & Portrait, 3D Installation, Others); Display Unit (LCD, LED, LPD, Others); Deployment Type (Touch-Based, Touch less, Multi Touch, Others); End Users (Retail, IT and Telecommunications, Government and Defence, Media and Entertainment, Others); and Geography (North America, Europe, Asia Pacific, and South and Central America)
- Status : Data Released
- Report Code : TIPRE00003469
- Category : Electronics and Semiconductor
- No. of Pages : 150
- Available Report Formats :


- Last update date : October 16, 2026


2025 Market Size
US$ 13.58 Bn
Base year value
2034 Forecast
US$ 28.97 Bn
Projected by 2034
CAGR 2026-2034
8.78 %
Growth rate
Addressable Market
US$ 190.59 Bn
(2026-2034)
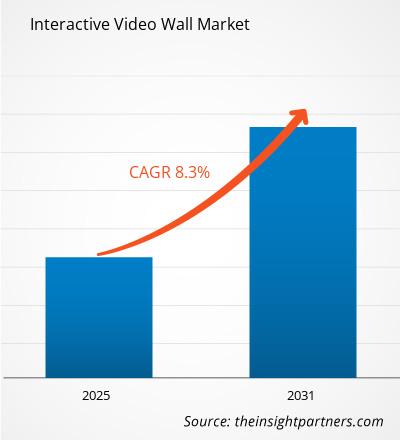
The Interactive Video Wall Market was valued at US$ 13.58 Billion in 2025 and is projected to reach US$ 28.97 Billion by 2034, registering a CAGR of 8.78% during 2026–2034. The expansion can be attributed to the rising need for large-screen, networked visual environments which comprise high-resolution displays, interactive technology, content management, analytics, and integration services for applications such as retail spaces, control rooms, infrastructure, offices, and media production.
The North American Interactive Video Wall Market Size is anticipated to grow at a CAGR of 7.5% to 8.5% through 2034, driven by the installation of new direct-view LED screens and replacement of narrow-bezel LCD installations in command centers, retail, and experience-based facilities. The cloud-based content orchestration capabilities and enterprise-level remote monitoring enhance the efficiency of the fleets.
Interactive Video Wall Market Assessment and Insights
- North America: Accounted for 32–34% share in 2025 and is modelled to grow at 7.5–8.5% CAGR during 2026–2034, supported by control-room modernization, retail experience upgrades, and mature integration channels.
- US: Represented 78–82% of North American revenue in 2025 and is modelled to expand at 7.6–8.6% CAGR through 2034.
- Europe: Held 25–27% share in 2025 and is modelled at 7.0–8.0% CAGR, with Germany, the UK, and France leading enterprise, transport, and media deployment.
- Asia Pacific: Captured 27–29% share in 2025 and is modelled to record 10.0–11.0% CAGR, led by China, Japan, South Korea, and India.
- Largest Segment: LCD held 49–53% market share in 2025 and is modelled to grow at 6.5–7.5% CAGR through 2034.
- High Growth Segment: 3D Installation represented 8–10% market share in 2025 and is modelled at 12.0–13.0% CAGR through 2034.
- Key companies analyzed in detail: ADFLOW Networks, a Daktronics Company; AUO Corporation; LG Display Co., Ltd.; Sharp NEC Display Solutions, Ltd.; Omnivex Corporation; Panasonic Holdings Corporation; Koninklijke Philips N.V.; Samsung Electronics Co., Ltd.; Sony Group Corporation; Toshiba Corporation.
Source: The Insight Partners' analysis based on proprietary research, government publications, company annual reports, investor presentations, industry databases, and expert interviews.
From tiled LCD systems using external processing systems, product architectures have evolved towards higher resolution LED canvases, system on chip controllers, multi-stream compositing, and cloud-based content management. Improvements in manufacturing economics will be driven by cabinet standardization, front service access, automatic calibration, and common platform controllers, which will reduce installation costs. Meanwhile, pixel pitch choice, thermal management, redundancy, and color calibration will continue to drive long term costs. Such trends are consistent with professional AV industry evidence suggesting direct view LED display technology, content management, and managed services are influencing deployment decisions.
Through 2034, new opportunities will arise not only at prime city sites but also at tier-two cities, transportation hubs, industrial complexes, and public services sites. New sources of funding will prefer solutions incorporating engagement metrics, remote management capabilities, enhanced cybersecurity, and reduced energy use. Regulations around accessibilities, data privacy and security, and device efficiency will increasingly drive specification criteria. Those suppliers who can deliver displays, applications, installation services, maintenance, and performance metrics should win larger lifetime contracts.
Interactive Video Wall Market Report Scope
| Report Attribute | Details |
|---|---|
| Market size in 2025 | US$ 13.58 Billion |
| Market Size by 2034 | US$ 28.97 Billion |
| Global CAGR (2026 - 2034) | 8.78% |
| Historical Data | 2021-2024 |
| Forecast period | 2026-2034 |
Interactive Video Wall Market Analysis
IInteractive Video Wall Market growth hinges on the requirement for displaying increasing amounts of operational, promotional, and collaborative information without dividing one's attention among multiple screens. Retailers use the walls for localizing marketing campaigns and selling, whereas governments and telecoms focus on the simultaneous display of alarms, maps, and live video feeds. The market involves panel and LED module makers, touch overlay suppliers, processors, wall mounting providers, software companies, integrators, and managed services providers.
Modularity in the supply chain is growing, as standard cabinets, front access maintenance, automated calibration, and built-in media players cut field work; however, there are still issues like semiconductors availability, quality of LED binning, and installation expertise. Buyers are now looking at the whole picture – from electricity costs to content development, monitoring, spare modules, and service levels.
Interactive Video Wall Market Report reveals competition between electronics companies and software-driven players. The impact on display functionality and manufacturing costs comes from Samsung Electronics Co., Ltd., LG Display Co., Ltd., AUO Corporation, and Sony Group Corporation. The areas of orchestration and network management are augmented by Omnivex Corporation and ADFLOW Networks. Sharp NEC Display Solutions, Panasonic Holdings Corporation, Philips, and Toshiba bring in existing enterprise distribution and application credibility.
Key areas for investments are: microLED technology; fine-pitch COB packages; AI-based image processing; cloud-managed devices security; analytics. Strategic positioning will be focused on open APIs, compatibility with office/production control room environments, recurring services. Providers who will certify partner integrators and stock parts in regions will sustain their margins; software solutions will generate recurring revenues.
● REPORT CUSTOMIZATION
Tailor This Report To Align With Your Specific Business Requirements
This report can be customized to align precisely with your business objectives, scope, and target markets. Customization options include tailored segmentation, geography, competitive analysis, and strategic insights to support informed decision-making.
Customize This Report →WHAT YOU CAN ADJUST
- ● Segmentations
- ● Geography
- ● Competitive Analysis
- ● Language Preferences
Interactive Video Wall Market: Strategic Insights

Regional Insights
North America Interactive Video Wall Market
The area accounted for 32–34% Interactive Video Wall Market share in 2025 and is forecasted to exhibit 7.5–8.5% CAGR till 2034. Installed base refreshes, advanced enterprise AV sourcing, and use in control rooms fuel demand. Flagship retail stores, broadcasting studios, universities, airports, and public safety operations choose narrow bezel LCD or fine pitch LED with centralized management of content and devices.
The difference comes in through lifecycle services in multisplay calibration, process setup, cybersecurity, and uptime where the need for local expertise arises. The direct view LED will be the choice whenever there is a need for seamless imaging and flexibility, while the LCD will be competitive where standard indoor grid installation is concerned.
U.S. Interactive Video Wall Market
North America revenue accounted for 78-82% in the U.S. in 2025 and is forecasted at 7.6-8.6% CAGR growth. High corporate, retail, entertainment, military and transportation demand facilitates massive deployment of systems. Brand experience centers leverage interactive content to facilitate product discovery, while utilities and government agencies need constant multi-source visualization with redundant processors and fast field service.
Major vendors provide direct sales force, certified integrators and local support organizations, thus reducing design and replacement cycles. Trends are moving towards fine-pitch LED in brand experience centers and command centers, and multi-touch LCD in collaborative rooms. Enterprise purchases are becoming more and more inclined towards secure cloud management, API integration, ADA compliant interface and content performance measurements.
Europe Interactive Video Wall Market
Market shares in 2025 in Europe stood at 25% to 27% and forecasted CAGR of 7.0% to 8.0%. Market leader in Europe is Germany with its strong industrial management, business modernization, and exhibition facilities. Advantages of the UK include retail media, finance dealing rooms, transportation, and broadcasting facilities where availability and connectivity to office space matters.
In France, the combination of top retailing, museums, public facilities, and transport modernization is used. The hospitality sector, luxury retailing, and culture industry in Italy create opportunities for experiential projects, whereas Spain is advantaged by tourism facilities, smart city programs, and modern transport infrastructure. Energy efficiency standards and circular procurement policies make services and durability important.
APAC Interactive Video Wall Market
Asia Pacific in 2025 holds a market share of 27-29%, with a forecasted growth rate of 10.0-11.0% CAGR. China rules by virtue of its LED manufacturing, smart infrastructure, and expansion in retail operations. Advanced display technology is the focus for Japan and South Korea, while India is developing digital infrastructure at public places and organized retailing.
Australia has the advantage of mature uses in transport, education, and enterprises. The local manufacturing capability leads to cost-effective components and innovative fine pitch development. Smart city, digital government, advanced manufacturing, and tourism infrastructure policies have expanded the target market despite variations in channel performance.
Middle East & Africa Interactive Video Wall Market
The CAGR for the expansion of MEA is set between 8.5%-9.5%. The top market of Saudi Arabia is driven by giga-projects, transport, tourism, and command centers, while UAE focuses on premium retail, airports, hospitality and events. The South African market has a strong presence of demand from corporate, broadcasting and security sectors.
In the Rest of MEA, the deployment is selective and mostly limited to capital cities, energy installations, telecom sites and public places. Demand is driven by infrastructure spending and diversification initiatives, but import dependency and specialized servicing availability determine the scheduling of the projects.
Segmentation Analysis
Types
The Interactive Video Wall Market scope by type spans standardized grids and architecturally complex canvases, with the main segment modelled at 8.3–9.3% CAGR during 2026–2034. Demand is moving toward adaptable formats that fit irregular surfaces, immersive rooms, and experiential venues while reducing structural complexity. Standardized systems retain cost and service advantages for control rooms and corporate applications.
- Custom Layout: Demand centers on flagship retail, museums, studios, and branded environments where irregular dimensions, curves, or architectural integration differentiate the experience and justify specialist design.
- Standard Layout: Standard grids remain important in control rooms, classrooms, and meeting spaces because predictable mounting, spares, calibration, and commissioning simplify procurement and lifecycle support.
- Landscape & Portrait: Orientation flexibility supports campaign reuse, wayfinding, product visualization, and social-format content, helping operators deploy common hardware across multiple venue types and communication objectives.
- 3D Installation: Glasses-free depth, anamorphic content, and immersive staging create premium engagement in entertainment and experiential retail, but content cost and viewing geometry remain adoption considerations.
Display Unit
Display Unit is modelled to expand at 8.0–9.0% CAGR during 2026–2034. LCD benefits from established supply and standardized indoor use, while LED gains in seamless, bright, and custom-sized installations. Procurement depends on viewing distance, ambient light, bezel tolerance, service access, energy use, camera compatibility, and expected operating hours.
- LCD: LCD holds the broadest installed base for indoor multi-panel walls, supported by competitive pricing, mature mounting ecosystems, familiar servicing, and improving bezel performance.
- LED: Direct-view LED is strategically important for seamless large canvases, high brightness, flexible aspect ratios, and front-serviceability across lobbies, studios, command centers, and venues.
- LPD: Laser phosphor display retains niche relevance where image uniformity, long operating life, and tiled architecture matter, although narrower supplier availability constrains broader adoption.
Deployment Type
Deployment Type is modelled at 9.0–10.0% CAGR during 2026–2034 as interaction expands beyond single-user touch. Selection reflects hygiene, accessibility, latency, concurrent-user needs, content design, and environmental durability. Touchless interfaces suit public environments, while multi-touch systems support collaborative analytics, planning, and educational applications requiring simultaneous manipulation of complex visual information.
- Touch-Based: Conventional touch remains widely adopted for wayfinding, product discovery, assisted selling, and collaboration because user behavior is familiar and application tooling is mature.
- Touch less: Gesture, proximity, voice, and device-based control reduce surface contact and support accessible public interaction, but reliable sensing and intuitive content design are essential.
- Multi Touch: Multi-touch provides strategic value in command, design, education, and planning environments where several users must annotate, compare, and reorganize information concurrently.
End Users
End Users are modelled to expand at 8.5–9.5% CAGR during 2026–2034. Retail leads experience-focused adoption, government and defense prioritize resilient visualization, telecommunications uses network operation centers, and media companies invest in virtual production and broadcast backdrops. Decisions are increasingly tied to measurable workflow improvement, audience engagement, uptime, and content agility.
- Retail: Retail deployments combine campaign storytelling, digital merchandising, assisted selling, and retail-media inventory, making content freshness and integration with analytics central to investment returns.
- IT and Telecommunications: Network operations teams require persistent multi-source monitoring, role-based workflows, and high availability, supporting processor redundancy, secure remote management, and service contracts.
- Government and Defence: Mission-critical rooms prioritize cybersecurity, redundancy, auditability, and long support cycles, creating demand for validated components, controlled access, and rapid maintenance response.
- Media and Entertainment: Broadcast, live events, studios, and virtual production value camera-ready color, refresh synchronization, immersive scale, and flexible content mapping across modular LED surfaces.
Opportunity Snapshot
| End Users | Revenue Contribution | Trend Tag | Adoption Stage |
| Retail | High | Retail Media | Scaling |
| IT and Telecommunications | Medium | Network Visibility | Mature |
| Government and Defence | High | Mission Visualization | Mature |
| Media and Entertainment | High | Virtual Production | Scaling |
| Others | Medium | Venue Experience | Emerging |
Interactive Video Wall Market Growth Drivers and Impact Analysis
Experience-led retail and venue investment
Physical venues are using large interactive canvases to connect digital content with in-person decision moments. Retailers can rotate campaigns, explain complex products, localize promotions, and support assisted selling without rebuilding fixtures. Stadiums, museums, hotels, and transport terminals similarly use dynamic walls for navigation, sponsorship, entertainment, and crowd communication. The market impact extends beyond panel sales because every installation requires content creation, processors, mounts, connectivity, analytics, and recurring support. Suppliers that demonstrate measurable engagement and operational flexibility can convert pilots into multi-site standards. The strongest projects link display content to inventory, event schedules, audience context, or loyalty systems, making the wall an operational interface rather than a decorative surface.
Control-room modernization and data-intensive operations
Utilities, telecom operators, public-safety agencies, defense organizations, and transport networks are consolidating more live feeds into shared decision environments. Interactive walls help teams correlate maps, alarms, video, dashboards, and incident records while preserving a common operating picture. Replacement demand grows when aging cubes or narrow-bezel LCD arrays become costly to maintain or cannot support newer resolutions and sources. High-availability processors, redundant signal paths, secure device management, and front-service modules therefore command value. This driver supports longer procurement cycles but also produces larger lifecycle contracts, including commissioning, training, spares, calibration, and service-level coverage. Vendors with cybersecurity credentials and local response capacity are better placed to win mission-critical projects.
Falling complexity of modular LED deployment
Direct-view LED adoption is broadening as standardized cabinets, finer pixel pitches, improved packaging, automated calibration, and front-access servicing reduce integration risk. Seamless surfaces eliminate bezel interruption and allow designers to choose dimensions that match architecture rather than fixed panel ratios. Improved brightness control and image processing also support mixed-use spaces, including corporate lobbies, studios, command centers, and premium retail. The market impact is a gradual shift in project value from commodity flat panels toward engineered systems combining modules, controllers, mounting, power, and software. Installation quality remains critical, so manufacturers are expanding certification and diagnostics. As serviceability improves, buyers can justify LED through longer operating life, modular repair, and design flexibility.
Interactive Video Wall Market Future Trends
Context-aware content orchestration
Interactive Video Wall Market trends will increasingly center on software that adapts content to context while preserving privacy and governance. Edge analytics can interpret occupancy, schedules, operational events, and content performance without moving every data stream to the cloud. Generative tools will accelerate layout creation and localization, while approval workflows protect brand consistency. For control rooms, AI can prioritize alarms and recommend views; for retail, it can select relevant product stories. Adoption will depend on explainability, opt-in data practices, cybersecurity, and human override. Vendors combining open APIs, device telemetry, and auditable content logic will move from display supplier to workflow partner.
Serviceable, lower-energy visual infrastructure
Procurement will increasingly compare energy use, replacement cycles, repair access, and material recovery alongside brightness and resolution. Automatic luminance control, efficient power supplies, scheduled operation, and remote fault detection can reduce operating cost across large fleets. Modular LED designs will favor replaceable components and front service, while LCD buyers will seek longer support windows and standardized spares. Sustainability reporting will create demand for device-level power data and lifecycle documentation. This shift will reward suppliers that quantify savings, design for repair, and offer refurbishment or take-back pathways. Energy performance will become a commercial specification rather than a secondary environmental claim.
Interactive Video Wall Market Opportunities
Managed visualization as a service
Integrators can build recurring revenue by bundling design, financing, content operations, remote monitoring, preventive maintenance, and performance reporting. The opportunity is strongest among multi-site retailers, campuses, and public venues that lack specialist AV staff but need consistent uptime and campaigns. Standard device profiles and cloud orchestration allow centralized teams to manage mixed display estates, while local partners handle physical intervention. Contracts can be structured around availability, content turnaround, or site outcomes rather than hardware alone. This model lowers initial barriers, improves refresh planning, and gives providers visibility into lifecycle needs. Success requires transparent service levels, cybersecurity responsibilities, and predictable spare-parts logistics.
Localized platforms for fast-growing urban markets
Tier-two cities across Asia, the Middle East, Latin America, and Africa offer investment potential as malls, transport nodes, hospitals, universities, and government facilities modernize. Global products often require adaptation for language, climate, connectivity, power quality, and support coverage. Vendors can address this gap through regional assembly, certified local integrators, offline-capable content management, remote diagnostics, and financing partnerships. Modular systems sized for phased expansion can fit constrained budgets while preserving upgrade paths. Opportunity capture will depend on training technicians, maintaining regional spares, and designing content templates for local use cases. Partnerships with architects and infrastructure contractors can place visualization earlier in project specifications.
Recent Developments
- November 2025: Samsung Electronics Co., Ltd. – introduced The Wall MPF series, expanding its Chip on Board large-format LED portfolio. The product provides 1,000-nit brightness, AI upscaling, 43,000:1 contrast, a cabinet depth reduced by 35%, and weight reduced by 18%, targeting corporate, government, retail, hospitality, and healthcare environments.
- September 2025: LG Electronics USA, Inc launched LG MAGNIT ProAV Series MicroLED displays with Megapixel’s HELIOS processing platform and added 163-inch and 136-inch all-in-one 4K models. The platform supports real-time mapping, multi-user control, seam correction, monitoring, and diagnostics, strengthening usability for complex professional visualization installations.
- August 2026: Qtenboard has introduced its 2026 flagship zero-bezel LCD video wall series, designed to deliver seamless, high-impact visual experiences for commercial, retail, education and professional environments. The new video wall range is aimed at organisations looking for large-format display solutions that combine high-resolution visuals with a streamlined, near-seamless appearance.
Frequently Asked Questions

- Comprehensive Market Sizing and Forecast Analysis
- Detailed Segmentation Analysis
- In-Depth Market Dynamics Assessment
- Regional and Country-Level Insights
- Competitive Landscape and Company Benchmarking
- Strategic Business Intelligence
Recent Reports
Testimonials

The Insight Partners provided valuable market intelligence that supported our global go-to-market strategy. Their team was professional, responsive, and attentive to our feedback, providing thoughtful analysis and helpful methodological clarifications throughout the project.
Junmo Kim Chief Financial Officer (CFO), Enertech Co., Ltd.
The Insight Partners' SCADA System Market report is comprehensive, with valuable insights on current trends and future forecasts. The team was highly professional, responsive, and supportive throughout. We are very satisfied and highly recommend their services.
RAN KEDEM Partner, Reali Technologies LTDs
I requested a report on a very specific software market and the team produced the report in a few days. The information was very relevant and well presented. I then requested some changes and additions to the report. The team was again very responsive and I got the final report in less than a week.
JEAN-HERVE JENN Chairman, Future Analytica
We worked with The Insight Partners for an important market study and forecast. They gave us clear insights into opportunities and risks, which helped shape our plans. Their research was easy to use and based on solid data. It helped us make smart, confident decisions. We highly recommend them.
PIYUSH NAGPAL Sr. Vice President, High Beam Global
The Insight Partners delivered insightful, well-structured market research with strong domain expertise. Their team was professional and responsive throughout. The user-friendly website made accessing industry reports seamless. We highly recommend them for reliable, high-quality research services
YUKIHIKO ADACHI CEO, Deep Blue, LLC.
This is the first time I have purchased a market report from The Insight Partners.While I was unsure at first, I visited their web site and felt more comfortable to take the risk and purchase a market report.I am completely satisfied with the quality of the report and customer service. I had several questions and comments with the initial report, but after a couple of dialogs over email with their analyst I believe I have a report that I can use as input to our strategic planning process.Thank you so much for taking the extra time and making this a positive experience.I will definitely recommend your service to others and you will be my first call when we need further market data.
JOHN SUZUKI President and Chief Executive Officer, Board Director, BK Technologies
I wish to appreciate your support and the professionalism you displayed in the course of attending to my request for information regarding to infectious disease IVD market in Nigeria. I appreciate your patience, your guidance, and the fact that you were willing to offer a discount, which eventually made it possible for us to close a deal. I look forward to engaging The Insight Partners in the future, all thanks to the impression you have created in me as a result of this first encounter.
DR CHIJIOKE ONYIA MANAGING DIRECTOR, PineCrest Healthcare Ltd.Reason to Buy
- Informed Decision-Making
- Understanding Market Dynamics
- Competitive Analysis
- Identifying Emerging Markets
- Customer Insights
- Market Forecasts
- Risk Mitigation
- Boosting Operational Efficiency
- Strategic Planning
- Investment Justification
- Tracking Industry Innovations
- Aligning with Regulatory Trends





 Get Free Sample for