$5190
$4152
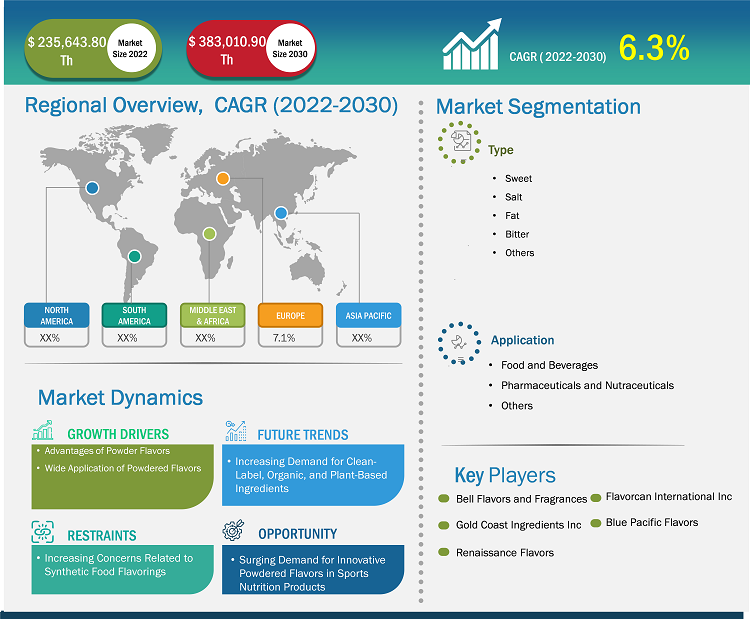
[Research Report] The flavor masking agents market size is projected to grow from US$ 235.64 million in 2022 to US$ 383.01 million by 2030; it is expected to register a CAGR of 6.3% from 2022 to 2030.
Market Insights and Analyst View:
Flavor masking agents are additives and compounds that mask the undesirable flavor of certain ingredients in processed food and beverages, pharmaceutical drugs, dietary supplements, and pet food. The flavor masking agents market has witnessed significant growth owing to the increasing consumption of processed foods. Moreover, increasing demand from the sports nutrition industry is estimated to boost the flavor masking agents market in the coming years.
Growth Drivers and Challenges:
Consumers are highly concerned about their diet. They pay attention to product labels and additives used in processed foods and beverages. The popularity of organic products is increasing owing to their perceived health benefits. They are free of pesticides, chemical fertilizers, and genetically modified organisms (GMOs), which increase their appeal among consumers who are ready to pay higher prices. Moreover, consumers increasingly prefer clean-label food products free of synthetic colors, flavors, and other additives. Further, they focus on holistic and conscious consumption and prefer products made with ethically sourced additives. Thus, the demand for natural additives is increasing in the food & beverage industry. Kerry Group, one of the known manufacturers of flavor masking agents, offers ‘Prolamin Coating,’ a natural flavor masking agent. It is a known masking agent for bitter taste masking. Prolamin is a plant storage protein found in the seeds of cereal grains such as rice and oats and accounts for ~5–10 % of the total proteins in those plants. Thus, an upsurging demand for natural additives is expected to create a new trend in the flavor masking agents market in the coming years.
Customize Research To Suit Your Requirement
We can optimize and tailor the analysis and scope which is unmet through our standard offerings. This flexibility will help you gain the exact information needed for your business planning and decision making.
Flavor Masking Agents Market: Strategic Insights
Market Size Value in US$ 235.64 million in 2022 Market Size Value by US$ 383.01 million by 2030 Growth rate CAGR of 6.3% from 2022 to 2030 Forecast Period 2022-2030 Base Year 2022

Shejal
Have a question?
Shejal will walk you through a 15-minute call to present the report’s content and answer all queries if you have any.
 Speak to Analyst
Customize Research To Suit Your Requirement
We can optimize and tailor the analysis and scope which is unmet through our standard offerings. This flexibility will help you gain the exact information needed for your business planning and decision making.
Flavor Masking Agents Market: Strategic Insights
| Market Size Value in | US$ 235.64 million in 2022 |
| Market Size Value by | US$ 383.01 million by 2030 |
| Growth rate | CAGR of 6.3% from 2022 to 2030 |
| Forecast Period | 2022-2030 |
| Base Year | 2022 |
Shejal
Have a question?
Shejal will walk you through a 15-minute call to present the report’s content and answer all queries if you have any.
Speak to Analyst
Report Segmentation and Scope:
The "Global Flavor Masking Agents Market" is segmented into type, application, and geography. By type, the flavor masking agents market is segmented into sweet, salt, fat, bitter, and others. In terms of application, the market is categorized into food and beverages, pharmaceuticals and nutraceuticals, and others. The food and beverages segment is further segmented into bakery and confectionery; dairy and frozen desserts; beverages; meat, poultry, and seafood; meat substitutes; dairy alternatives; RTE and RTC meals; and other food and beverages. Geographically, the flavor masking agents market is segmented into North America (the US, Canada, and Mexico), Europe (Germany, France, Italy, the UK, Russia, and the Rest of Europe), Asia Pacific (Australia, China, Japan, India, South Korea, and the Rest of Asia Pacific), the Middle East & Africa (South Africa, Saudi Arabia, the UAE, and the Rest of Middle East & Africa), and South & Central America (Brazil, Argentina, and the Rest of South & Central America)
- Sample PDF showcases the content structure and the nature of the information with qualitative and quantitative analysis.
- Request discounts available for Start-Ups & Universities
Segmental Analysis
Based on type, the flavor masking agents market is segmented into sweet, salt, fat, bitter, and others. The bitter segment held the largest share of the flavor masking agents market; the sweet segment is expected to register the fastest CAGR during 2022–2030. The demand for bitter flavor masking agents is experiencing notable growth primarily due to consumers' sensitivity to bitterness and the expansion of products with bitter components. As consumer preferences evolve and the market diversifies with the introduction of new beverages, functional foods, fortified food & beverages, and health-focused products, and dietary supplements the need for effective bitter flavor masking agents increases. These agents enable the creation of a broader range of palatable products that cater to various consumer segments, addressing the demand for better-tasting, bitter-sensitive-friendly options in the market.
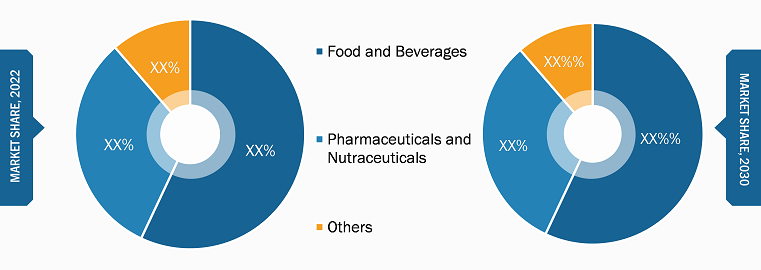
Based on application, the flavor masking agents market is segmented into food and beverages, pharmaceuticals and nutraceuticals, and others. The food and beverages segment held the largest market share in 2022. Flavor masking agents are widely used in bakery and confectionery, dairy and frozen desserts, meat substitutes, dairy alternative products, Ready-to-eat (RTE) and Ready-to-cook (RTCmeals, and meat and seafood products. Many processed fortified foods such as dairy items, meat products, and bakery and confectionery items contain vitamins, protein, and other functional ingredients with unpleasant odors and tastes. Flavor masking agents are widely used in these products to get the desired flavor and taste. Additionally, flavor masking agents allow for a reduction in the sugar, salt, and fat content of processed foods. Thus, increased consumption of processed foods propels the growth of flavor masking agents market.

- Sample PDF showcases the content structure and the nature of the information with qualitative and quantitative analysis.
- Request discounts available for Start-Ups & Universities
Regional Analysis:
Based on geography, the flavor masking agents market is divided into five key regions: North America, Europe, Asia Pacific, South & Central America, and Middle East & Africa. The global flavor masking agents market was dominated by Asia Pacific, which accounted for US$ 84.53 million in 2022. North America is a second major contributor, holding approximately 29% share of the global market. Additionally, Europe is expected to grow considerably at a CAGR of 7% from 2022 to 2030. Countries such as China and Japan are the largest market for sports nutrition industry in Asia Pacific owing to rising consumer interest in health and sports and continued presence of international sports festivals such as Olympics and Commonwealth Games. The consumption of nutritional supplements, including fortified food products with proteins, vitamins and minerals, is rapidly increasing. Manufacturers of nutritional supplements heavily rely on flavor masking agents to overcome the undesirable flavor of these supplements. Thus, rapidly growing sports nutrition industry in the region and growing interest of consumers in health and fitness are among the key factors anticipated to propel the flavor masking agents market growth during the forecast period.
Industry Developments and Future Opportunities:
Various initiatives taken by the key players operating in the flavor masking agents market are listed below:
- In May 2021, Synergy Flavors acquired Innova Flavors from Griffith Foods Worldwide. The acquisition aimed at expanding the savory capabilities of Synergy Flavors in alignment with the exciting new product development happening in meat alternatives, sauces, side dishes, and snacks.
- In June 2023, Kerry announced the launch of its next generation Tastesense Advanced portfolio of solutions, which aims to redefine the low and zero-sugar product market by delivering incomparable sweetness and full-bodied mouthfeel, as well as sustainability benefits. Tastesense Advanced is a low-cost alternative to sugar and stevia that promotes the development of sweetness closer to sugar and well above 30 Brix sucrose sweetness equivalence, with improved flavour, mouthfeel, and fewer off-notes.
COVID-19 Impact:
The COVID-19 pandemic affected almost all industries in various countries. Lockdowns, travel restrictions, and business shutdowns in North America, Europe, Asia Pacific (APAC), South & Central America (SAM), and the Middle East & Africa (MEA) hampered the growth of several industries, including the food & beverages and pharmaceuticals & nutraceuticals industries. The shutdown of manufacturing units disturbed global supply chains, manufacturing activities, delivery schedules, and essential and nonessential product sales. Various companies witnessed delays in product deliveries and a slump in sales of their products in 2020.
However, in the wake of the pandemic, consumers increased the consumption of dietary supplements and multivitamins that boost immunity and support overall wellbeing. Flavor masking agents are widely used in dietary supplements to mask the off flavors of vitamins, minerals, proteins, and other fortification ingredients. This factor has a positive impact on the growth of flavor masking agents market. Further, the demand for plant-based meat and dairy products increased after the outbreak due to increased sustainability concerns and increased awareness of health benefits of plant-based products. Flavor masking agents and taste modulators are vital ingredients in plant-based meat and dairy products to mask the undesirable flavor and aroma of soy, pea, and other plant-based proteins. This factor also positively influenced the flavor masking agents market growth.
Competitive Landscape and Key Companies:
The top 10 companies operating in the global flavor masking agents market are Sensient Technologies Corp, Firmenich International SA, Tate & Lyle Plc, Archer-Daniels-Midland Co, Kerry Group Plc, Carmi Flavor & Fragrance Co Inc, Synergy Flavors Inc, Virginia Dare Extract Co Inc, GEO Specialty Chemicals Inc, and Koninklijke DSM NV. These players are focusing on developing plant-based, natural, organic, and clean-label flavor masking ingredients, which is expected to open new growth opportunities in the coming years.

Report Coverage
Revenue forecast, Company Analysis, Industry landscape, Growth factors, and Trends

Segment Covered
Type, and Application

Regional Scope
North America, Europe, Asia Pacific, Middle East & Africa, South & Central America

Country Scope
This text is related
to country scope.
Frequently Asked Questions
Sensient Technologies Corp, Firmenich International SA, Tate & Lyle Plc, Archer-Daniels-Midland Co, Kerry Group Plc, Carmi Flavor & Fragrance Co Inc, Synergy Flavors Inc, Virginia Dare Extract Co Inc, GEO Specialty Chemicals Inc, and Koninklijke DSM NV are a few players operating in the global flavor masking agents market.
In 2022, Asia Pacific held the largest share of the global flavor masking agents market. The food and beverage industry in Asia Pacific is rapidly growing with rising consumption of convenience food and beverages such as baked goods, chocolates and confectionery, dairy and frozen desserts, meat and seafood products, RTE and RTC meals, etc. This factor significantly drives the demand for flavor masking agents in the food and beverages industry across Asia Pacific.
Europe is estimated to register the fastest CAGR in the global flavor masking agents market over the forecast period. The rising demand for plant-derived meat and dairy products due to rising veganism trend is one of the key factors significantly driving the flavor masking agents market growth in the region.
Based on type, the bitter segment held the largest share in the global flavor masking agents market in 2022. Bitter masking agents are witnessing high demand in meat alternatives and plant-based dairy products, pet food due to off-notes of plant-based protein such as soy, pea, and beans. This factor, thereby, drives the growth of the segment.
Based on application, the food and beverage segment is estimated to register the fastest CAGR in the global flavor masking agents for food and beverages market over the forecast period. Rising veganism trend due to increasing awareness of animal cruelty at slaughterhouses and health benefits of plant-based food is driving the demand for flavor masking agents, thereby, driving the market growth.
Wide array of application scope in the food industry, pet food industry, animal feed industry and rising technological advancements are the two key factors driving the flavor masking agents market growth.
1. Introduction
1.1 The Insight Partners Research Report Guidance
1.2 Market Segmentation
2. Executive Summary
2.1 Key Market Insights
2.2 Market Attractiveness
3. Research Methodology
3.1 Coverage
3.2 Secondary Research
3.3 Primary Research
4. Flavor Masking Agents Market Landscape
4.1 Overview
4.2 Porter's Five Forces Analysis
4.2.1 Bargaining Power of Suppliers
4.2.2 Bargaining Power of Buyers
4.2.3 Threat of New Entrants
4.2.4 Competitive Rivalry
4.2.5 Threat of Substitutes
4.3 Ecosystem Analysis
4.3.1 Raw Material Suppliers
4.3.2 Manufacturing Process
4.3.3 Distributors or Suppliers
4.3.4 End-Use Industries
4.4 List of Vendors
5. Flavor Masking Agents Market - Key Industry Dynamics
5.1 Market Drivers
5.1.1 Wide Array of Application
5.1.2 Technological Advancements in Flavor Masking
5.2 Market Restraints
5.2.1 High Manufacturing Expenses Results in High Product Cost
5.3 Market Opportunities
5.3.1 Rising Use of Flavor Masking Agents in Plant-Based Products
5.4 Future Trends
5.4.1 Increasing Demand for Natural Additives
5.5 Impact of Drivers and Restraints:
6. Flavor Masking Agents Market - Global Market Analysis
6.1 Flavor Masking Agents Market Revenue (US$ Thousand), 2020 – 2030
6.2 Flavor Masking Agents Market Forecast and Analysis
7. Flavor Masking Agents Market Analysis - Type
7.1 Sweet
7.1.1 Overview
7.1.2 Sweet Market Revenue and Forecast to 2030 (US$ Thousand)
7.2 Salt
7.2.1 Overview
7.2.2 Salt Market Revenue and Forecast to 2030 (US$ Thousand)
7.3 Fat
7.3.1 Overview
7.3.2 Fat Market Revenue and Forecast to 2030 (US$ Thousand)
7.4 Bitter
7.4.1 Overview
7.4.2 Bitter Market Revenue and Forecast to 2030 (US$ Thousand)
7.5 Others
7.5.1 Overview
7.5.2 Others Market Revenue, and Forecast to 2030 (US$ Thousand)
8. Global Flavor Masking Agents Market Analysis – Application
8.1 Food and Beverages
8.1.1 Overview
8.1.2 Food and Beverages Market Revenue, and Forecast to 2030 (US$ Thousand)
8.1.3 Bakery and Confectionery
8.1.3.1 Overview
8.1.3.2 Bakery and Confectionery Market Revenue, and Forecast to 2030 (US$ Thousand)
8.1.4 Dairy and Frozen Desserts
8.1.4.1 Overview
8.1.4.2 Dairy and Frozen Desserts Market Revenue, and Forecast to 2030 (US$ Thousand)
8.1.5 Beverages
8.1.5.1 Overview
8.1.5.2 Beverages Market Revenue, and Forecast to 2030 (US$ Thousand)
8.1.6 Meat, Poultry, and Seafood
8.1.6.1 Overview
8.1.6.2 Meat, Poultry, and Seafood Market Revenue, and Forecast to 2030 (US$ Thousand)
8.1.7 Meat Substitutes
8.1.7.1 Overview
8.1.7.2 Meat Substitutes Market Revenue, and Forecast to 2030 (US$ Thousand)
8.1.8 Dairy Alternatives
8.1.8.1 Overview
8.1.8.2 Dairy Alternatives Market Revenue, and Forecast to 2030 (US$ Thousand)
8.1.9 RTE and RTC Meals
8.1.9.1 Overview
8.1.9.2 RTE and RTC Meals Market Revenue, and Forecast to 2030 (US$ Thousand)
8.1.10 Other Food and Beverages
8.1.10.1 Overview
8.1.10.2 Other Food and Beverages Market Revenue, and Forecast to 2030 (US$ Thousand)
8.2 Pharmaceuticals and Nutraceuticals
8.2.1 Overview
8.2.2 Pharmaceuticals and Nutraceuticals Market Revenue, and Forecast to 2030 (US$ Thousand)
8.3 Others
8.3.1 Overview
8.3.2 Others Market Revenue, and Forecast to 2030 (US$ Thousand)
9. Flavor Masking Agents Market - Geographical Analysis
9.1 North America
9.1.1 North America Flavor Masking Agents Market Overview
9.1.2 North America Flavor Masking Agents Market Revenue and Forecasts to 2030 (US$ Thousand)
9.1.3 North America Flavor Masking Agents Market Breakdown by Type
9.1.3.1 North America Flavor Masking Agents Market Revenue and Forecasts and Analysis - By Type
9.1.4 North America Flavor Masking Agents Market Breakdown by Application
9.1.4.1 North America Flavor Masking Agents Market Revenue and Forecasts and Analysis - By Application
9.1.5 North America Flavor Masking Agents Market Revenue and Forecasts and Analysis - By Countries
9.1.5.1 North America Flavor Masking Agents Market Breakdown by Country
9.1.5.2 US Flavor Masking Agents Market Revenue and Forecasts to 2030 (US$ Thousand)
9.1.5.2.1 US Flavor Masking Agents Market Breakdown by Type
9.1.5.2.2 US Flavor Masking Agents Market Breakdown by Application
9.1.5.3 Canada Flavor Masking Agents Market Revenue and Forecasts to 2030 (US$ Thousand)
9.1.5.3.1 Canada Flavor Masking Agents Market Breakdown by Type
9.1.5.3.2 Canada Flavor Masking Agents Market Breakdown by Application
9.1.5.4 Mexico Flavor Masking Agents Market Revenue and Forecasts to 2030 (US$ Thousand)
9.1.5.4.1 Mexico Flavor Masking Agents Market Breakdown by Type
9.1.5.4.2 Mexico Flavor Masking Agents Market Breakdown by Application
9.2 Europe
9.2.1 Europe Flavor Masking Agents Market Overview
9.2.2 Europe Flavor Masking Agents Market Revenue and Forecasts to 2030 (US$ Thousand)
9.2.3 Europe Flavor Masking Agents Market Breakdown by Type
9.2.3.1 Europe Flavor Masking Agents Market Revenue and Forecasts and Analysis - By Type
9.2.4 Europe Flavor Masking Agents Market Breakdown by Application
9.2.4.1 Europe Flavor Masking Agents Market Revenue and Forecasts and Analysis - By Application
9.2.5 Europe Flavor Masking Agents Market Revenue and Forecasts and Analysis - By Countries
9.2.5.1 Europe Flavor Masking Agents Market Breakdown by Country
9.2.5.2 Germany Flavor Masking Agents Market Revenue and Forecasts to 2030 (US$ Thousand)
9.2.5.2.1 Germany Flavor Masking Agents Market Breakdown by Type
9.2.5.2.2 Germany Flavor Masking Agents Market Breakdown by Application
9.2.5.3 France Flavor Masking Agents Market Revenue and Forecasts to 2030 (US$ Thousand)
9.2.5.3.1 France Flavor Masking Agents Market Breakdown by Type
9.2.5.3.2 France Flavor Masking Agents Market Breakdown by Application
9.2.5.4 Italy Flavor Masking Agents Market Revenue and Forecasts to 2030 (US$ Thousand)
9.2.5.4.1 Italy Flavor Masking Agents Market Breakdown by Type
9.2.5.4.2 Italy Flavor Masking Agents Market Breakdown by Application
9.2.5.5 UK Flavor Masking Agents Market Revenue and Forecasts to 2030 (US$ Thousand)
9.2.5.5.1 UK Flavor Masking Agents Market Breakdown by Type
9.2.5.5.2 UK Flavor Masking Agents Market Breakdown by Application
9.2.5.6 Russia Flavor Masking Agents Market Revenue and Forecasts to 2030 (US$ Thousand)
9.2.5.6.1 Russia Flavor Masking Agents Market Breakdown by Type
9.2.5.6.2 Russia Flavor Masking Agents Market Breakdown by Application
9.2.5.7 Rest of Europe Flavor Masking Agents Market Revenue and Forecasts to 2030 (US$ Thousand)
9.2.5.7.1 Rest of Europe Flavor Masking Agents Market Breakdown by Type
9.2.5.7.2 Rest of Europe Flavor Masking Agents Market Breakdown by Application
9.3 Asia Pacific
9.3.1 Asia Pacific Flavor Masking Agents Market Overview
9.3.2 Asia Pacific Flavor Masking Agents Market Revenue and Forecasts To 2030 (US$ Thousand)
9.3.3 Asia Pacific Flavor Masking Agents Market Breakdown by Type
9.3.3.1 Asia Pacific Flavor Masking Agents Market Revenue and Forecasts and Analysis - By Type
9.3.4 Asia Pacific Flavor Masking Agents Market Breakdown by Application
9.3.4.1 Asia Pacific Flavor Masking Agents Market Revenue and Forecasts and Analysis - By Application
9.3.5 Asia Pacific Flavor Masking Agents Market Breakdown by Country
9.3.5.1 Asia Pacific Flavor Masking Agents Market Breakdown by Country
9.3.5.2 China Flavor Masking Agents Market Revenue and Forecasts To 2030 (US$ Thousand)
9.3.5.2.1 China Flavor Masking Agents Market Breakdown by Type
9.3.5.2.2 China Flavor Masking Agents Market Breakdown by Application
9.3.5.3 Japan Flavor Masking Agents Market Revenue and Forecasts To 2030 (US$ Thousand)
9.3.5.3.1 Japan Flavor Masking Agents Market Breakdown by Type
9.3.5.3.2 Japan Flavor Masking Agents Market Breakdown by Application
9.3.5.4 India Flavor Masking Agents Market Revenue and Forecasts To 2030 (US$ Thousand)
9.3.5.4.1 India Flavor Masking Agents Market Breakdown by Type
9.3.5.4.2 India Flavor Masking Agents Market Breakdown by Application
9.3.5.5 Australia Flavor Masking Agents Market Revenue and Forecasts To 2030 (US$ Thousand)
9.3.5.5.1 Australia Flavor Masking Agents Market Breakdown by Type
9.3.5.5.2 Australia Flavor Masking Agents Market Breakdown by Application
9.3.5.6 South Korea Flavor Masking Agents Market Revenue and Forecasts To 2030 (US$ Thousand)
9.3.5.6.1 South Korea Flavor Masking Agents Market Breakdown by Type
9.3.5.6.2 South Korea Flavor Masking Agents Market Breakdown by Application
9.3.5.7 Rest of Asia Pacific Flavor Masking Agents Market Revenue and Forecasts To 2030 (US$ Thousand)
9.3.5.7.1 Rest of Asia Pacific Flavor Masking Agents Market Breakdown by Type
9.3.5.7.2 Rest of Asia Pacific Flavor Masking Agents Market Breakdown by Application
9.4 Middle East & Africa
9.4.1 Middle East & Africa Flavor Masking Agents Market Overview
9.4.2 Middle East & Africa Flavor Masking Agents Market Revenue and Forecasts to 2030 (US$ Thousand)
9.4.3 Middle East & Africa Flavor Masking Agents Market Breakdown by Type
9.4.3.1 Middle East & Africa Flavor Masking Agents Market and Forecasts and Analysis - By Type
9.4.4 Middle East & Africa Flavor Masking Agents Market Breakdown by Application
9.4.4.1 Middle East & Africa Flavor Masking Agents Market and Forecasts and Analysis - By Application
9.4.5 Middle East & Africa Flavor Masking Agents Market Revenue and Forecasts and Analysis - By Countries
9.4.5.1 Middle East & Africa Flavor Masking Agents Market Breakdown by Country
9.4.5.2 South Africa Flavor Masking Agents Market Revenue and Forecasts to 2030 (US$ Thousand)
9.4.5.2.1 South Africa Flavor Masking Agents Market Breakdown by Type
9.4.5.2.2 South Africa Flavor Masking Agents Market Breakdown by Application
9.4.5.3 Saudi Arabia Flavor Masking Agents Market Revenue and Forecasts to 2030 (US$ Thousand)
9.4.5.3.1 Saudi Arabia Flavor Masking Agents Market Breakdown by Type
9.4.5.3.2 Saudi Arabia Flavor Masking Agents Market Breakdown by Application
9.4.5.4 UAE Flavor Masking Agents Market Revenue and Forecasts to 2030 (US$ Thousand)
9.4.5.4.1 UAE Flavor Masking Agents Market Breakdown by Type
9.4.5.4.2 UAE Flavor Masking Agents Market Breakdown by Application
9.4.5.5 Rest of Middle East & Africa Flavor Masking Agents Market Revenue and Forecasts to 2030 (US$ Thousand)
9.4.5.5.1 Rest of Middle East & Africa Flavor Masking Agents Market Breakdown by Type
9.4.5.5.2 Rest of Middle East & Africa Flavor Masking Agents Market Breakdown by Application
9.5 South & Central America
9.5.1 South & Central America Flavor Masking Agents Market Overview
9.5.2 South & Central America Flavor Masking Agents Market Revenue and Forecasts to 2030 (US$ Thousand)
9.5.3 South & Central America Flavor Masking Agents Market Breakdown by Type
9.5.3.1 South & Central America Flavor Masking Agents Market and Forecasts and Analysis - By Type
9.5.4 South & Central America Flavor Masking Agents Market Breakdown by Application
9.5.4.1 South & Central America Flavor Masking Agents Market Revenue and Forecasts and Analysis - By Application
9.5.5 South & Central America Flavor Masking Agents Market Revenue and Forecasts and Analysis - By Countries
9.5.5.1 South & Central Flavor Masking Agents Market Breakdown by Country
9.5.5.2 Brazil Flavor Masking Agents Market Revenue and Forecasts to 2030 (US$ Thousand)
9.5.5.2.1 Brazil Flavor Masking Agents Market Breakdown by Type
9.5.5.2.2 Brazil Flavor Masking Agents Market Breakdown by Application
9.5.5.3 Argentina Flavor Masking Agents Market Revenue and Forecasts to 2030 (US$ Thousand)
9.5.5.3.1 Argentina Flavor Masking Agents Market Breakdown by Type
9.5.5.3.2 Argentina Flavor Masking Agents Market Breakdown by Application
9.5.5.4 Rest of South & Central America Flavor Masking Agents Market Revenue and Forecasts to 2030 (US$ Thousand)
9.5.5.4.1 Rest of South & Central America Flavor Masking Agents Market Breakdown by Type
9.5.5.4.2 Rest of South & Central America Flavor Masking Agents Market Breakdown by Application
10. Flavor Masking Agents Market – Impact of COVID-19 Pandemic
10.1 Pre & Post COVID-19 Impact
11. Competitive Landscape
11.1 Heat Map Analysis By Key Players
11.2 Company Positioning & Concentration
12. Company Profiles
12.1 Sensient Technologies Corp
12.1.1 Key Facts
12.1.2 Business Description
12.1.3 Products and Services
12.1.4 Financial Overview
12.1.5 SWOT Analysis
12.1.6 Key Developments
12.2 Firmenich International SA
12.2.1 Key Facts
12.2.2 Business Description
12.2.3 Products and Services
12.2.4 Financial Overview
12.2.5 SWOT Analysis
12.2.6 Key Developments
12.3 Tate & Lyle Plc
12.3.1 Key Facts
12.3.2 Business Description
12.3.3 Products and Services
12.3.4 Financial Overview
12.3.5 SWOT Analysis
12.3.6 Key Developments
12.4 Archer-Daniels-Midland Co
12.4.1 Key Facts
12.4.2 Business Description
12.4.3 Products and Services
12.4.4 Financial Overview
12.4.5 SWOT Analysis
12.4.6 Key Developments
12.5 Kerry Group Plc
12.5.1 Key Facts
12.5.2 Business Description
12.5.3 Products and Services
12.5.4 Financial Overview
12.5.5 SWOT Analysis
12.5.6 Key Developments
12.6 Carmi Flavor & Fragrance Co Inc
12.6.1 Key Facts
12.6.2 Business Description
12.6.3 Products and Services
12.6.4 Financial Overview
12.6.5 SWOT Analysis
12.6.6 Key Developments
12.7 Synergy Flavors Inc
12.7.1 Key Facts
12.7.2 Business Description
12.7.3 Products and Services
12.7.4 Financial Overview
12.7.5 SWOT Analysis
12.7.6 Key Developments
12.8 Virginia Dare Extract Co Inc
12.8.1 Key Facts
12.8.2 Business Description
12.8.3 Products and Services
12.8.4 Financial Overview
12.8.5 SWOT Analysis
12.8.6 Key Developments
12.9 GEO Specialty Chemicals Inc
12.9.1 Key Facts
12.9.2 Business Description
12.9.3 Products and Services
12.9.4 Financial Overview
12.9.5 SWOT Analysis
12.9.6 Key Developments
12.10 Koninklijke DSM NV
12.10.1 Key Facts
12.10.2 Business Description
12.10.3 Products and Services
12.10.4 Financial Overview
12.10.5 SWOT Analysis
12.10.6 Key Developments
13. Appendix
List of Tables
Table 1. Flavor Masking Agents Market Segmentation
Table 2. List of Vendors in the Value Chain
Table 3. Flavor Masking Agents Market Revenue and Forecasts To 2030 (US$ Thousand)
Table 4. Global Flavor Masking Agents Market Revenue and Forecasts To 2030 (US$ Thousand) – Type
Table 5. Global Flavor Masking Agents Market Revenue and Forecasts To 2030 (US$ Thousand) – Application
Table 6. North America Flavor Masking Agents Market Revenue and Forecasts To 2030 (US$ Thousand) – By Type
Table 7. North America Flavor Masking Agents Market Revenue and Forecasts To 2030 (US$ Thousand) – By Application
Table 8. US Flavor Masking Agents Market Revenue and Forecasts To 2030 (US$ Thousand) – By Type
Table 9. US Flavor Masking Agents Market Revenue and Forecasts To 2030 (US$ Thousand) – By Application
Table 10. Canada Flavor Masking Agents Market Revenue and Forecasts To 2030 (US$ Thousand) – By Type
Table 11. Canada Flavor Masking Agents Market Revenue and Forecasts To 2030 (US$ Thousand) – By Application
Table 12. Mexico Flavor Masking Agents Market Revenue and Forecasts To 2030 (US$ Thousand) – By Type
Table 13. Mexico Flavor Masking Agents Market Revenue and Forecasts To 2030 (US$ Thousand) – By Application
Table 14. Europe Flavor Masking Agents Market Revenue and Forecasts To 2030 (US$ Thousand) – By Type
Table 15. Europe Flavor Masking Agents Market Revenue and Forecasts To 2030 (US$ Thousand) – By Application
Table 16. Germany Flavor Masking Agents Market Revenue and Forecasts To 2030 (US$ Thousand) – By Type
Table 17. Germany Flavor Masking Agents Market Revenue and Forecasts To 2030 (US$ Thousand) – By Application
Table 18. France Flavor Masking Agents Market Revenue and Forecasts To 2030 (US$ Thousand) – By Type
Table 19. France Flavor Masking Agents Market Revenue and Forecasts To 2030 (US$ Thousand) – By Application
Table 20. Italy Flavor Masking Agents Market Revenue and Forecasts To 2030 (US$ Thousand) – By Type
Table 21. Italy Flavor Masking Agents Market Revenue and Forecasts To 2030 (US$ Thousand) – By Application
Table 22. UK Flavor Masking Agents Market Revenue and Forecasts To 2030 (US$ Thousand) – By Type
Table 23. UK Flavor Masking Agents Market Revenue and Forecasts To 2030 (US$ Thousand) – By Application
Table 24. Russia Flavor Masking Agents Market Revenue and Forecasts To 2030 (US$ Thousand) – By Type
Table 25. Russia Flavor Masking Agents Market Revenue and Forecasts To 2030 (US$ Thousand) – By Application
Table 26. Rest of Europe Flavor Masking Agents Market Revenue and Forecasts To 2030 (US$ Thousand) – By Type
Table 27. Rest of Europe Flavor Masking Agents Market Revenue and Forecasts To 2030 (US$ Thousand) – By Application
Table 28. Asia Pacific Flavor Masking Agents Market Revenue and Forecasts To 2030 (US$ Thousand) – Type
Table 29. Asia Pacific Flavor Masking Agents Market Revenue and Forecasts To 2030 (US$ Thousand) – Application
Table 30. China Flavor Masking Agents Market Revenue and Forecasts To 2030 (US$ Thousand) – Type
Table 31. China Flavor Masking Agents Market Revenue and Forecasts To 2030 (US$ Thousand) – Application
Table 32. Japan Flavor Masking Agents Market Revenue and Forecasts To 2030 (US$ Thousand) – Type
Table 33. Japan Flavor Masking Agents Market Revenue and Forecasts To 2030 (US$ Thousand) – Application
Table 34. India Flavor Masking Agents Market Revenue and Forecasts To 2030 (US$ Thousand) – Type
Table 35. India Flavor Masking Agents Market Revenue and Forecasts To 2030 (US$ Thousand) – Application
Table 36. Australia Flavor Masking Agents Market Revenue and Forecasts To 2030 (US$ Thousand) – Type
Table 37. Australia Flavor Masking Agents Market Revenue and Forecasts To 2030 (US$ Thousand) – Application
Table 38. South Korea Flavor Masking Agents Market Revenue and Forecasts To 2030 (US$ Thousand) – Type
Table 39. South Korea Flavor Masking Agents Market Revenue and Forecasts To 2030 (US$ Thousand) – Application
Table 40. Rest of Asia Pacific Flavor Masking Agents Market Revenue and Forecasts To 2030 (US$ Thousand) – Type
Table 41. Rest of Asia Pacific Flavor Masking Agents Market Revenue and Forecasts To 2030 (US$ Thousand) – Application
Table 42. Middle East & Africa Flavor Masking Agents Market Revenue and Forecasts To 2030 (US$ Thousand) – By Type
Table 43. Middle East & Africa Flavor Masking Agents Market Revenue and Forecasts To 2030 (US$ Thousand) – By Application
Table 44. South Africa Flavor Masking Agents Market Revenue and Forecasts To 2030 (US$ Thousand) – By Type
Table 45. South Africa Flavor Masking Agents Market Revenue and Forecasts To 2030 (US$ Thousand) – By Application
Table 46. Saudi Arabia Flavor Masking Agents Market Revenue and Forecasts To 2030 (US$ Thousand) – By Type
Table 47. Saudi Arabia Flavor Masking Agents Market Revenue and Forecasts To 2030 (US$ Thousand) – By Application
Table 48. UAE Flavor Masking Agents Market Revenue and Forecasts To 2030 (US$ Thousand) – By Type
Table 49. UAE Flavor Masking Agents Market Revenue and Forecasts To 2030 (US$ Thousand) – By Application
Table 50. Rest of Middle East & Africa Flavor Masking Agents Market Revenue and Forecasts To 2030 (US$ Thousand) – By Type
Table 51. Rest of Middle East & Africa Flavor Masking Agents Market Revenue and Forecasts To 2030 (US$ Thousand) – By Application
Table 52. South & Central America Flavor Masking Agents Market Revenue and Forecasts To 2030 (US$ Thousand) – By Type
Table 53. South & Central America Flavor Masking Agents Market Revenue and Forecasts To 2030 (US$ Thousand) – By Application
Table 54. Brazil Flavor Masking Agents Market Revenue and Forecasts To 2030 (US$ Thousand) – By Type
Table 55. Brazil Flavor Masking Agents Market Revenue and Forecasts To 2030 (US$ Thousand) – By Application
Table 56. Argentina Flavor Masking Agents Market Revenue and Forecasts To 2030 (US$ Thousand) – By Type
Table 57. Argentina Flavor Masking Agents Market Revenue and Forecasts To 2030 (US$ Thousand) – By Application
Table 58. Rest of South & Central America Flavor Masking Agents Market Revenue and Forecasts To 2030 (US$ Thousand) – By Type
Table 59. Rest of South & Central America Flavor Masking Agents Market Revenue and Forecasts To 2030 (US$ Thousand) – By Application
Table 60. Heat Map Analysis By Key Players
List of Figures
Figure 1. Flavor Masking Agents Market Segmentation, By Geography
Figure 2. Porter's Five Forces Analysis
Figure 3. Ecosystem: Flavor Masking Agents Market
Figure 4. Flavor Masking Agents Market - Key Industry Dynamics
Figure 5. Impact Analysis of Drivers and Restraints
Figure 6. Global Flavor Masking Agents Market Revenue (US$ Thousand), 2020 – 2030
Figure 7. Global Flavor Masking Agents Market Share (%) – Type, 2022 and 2030
Figure 8. Sweet Market Revenue and Forecasts To 2030 (US$ Thousand)
Figure 9. Salt Market Revenue and Forecasts To 2030 (US$ Thousand)
Figure 10. Fat Market Revenue and Forecasts To 2030 (US$ Thousand)
Figure 11. Bitter Market Revenue and Forecasts To 2030 (US$ Thousand)
Figure 12. Others Market Revenue and Forecasts To 2030 (US$ Thousand)
Figure 13. Global Flavor Masking Agents Market Share (%) –Application, 2022 and 2030
Figure 14. Food and Beverages Market Revenue and Forecasts To 2030 (US$ Thousand)
Figure 15. Bakery and Confectionery Market Revenue and Forecasts To 2030 (US$ Thousand)
Figure 16. Dairy and Frozen Desserts Market Revenue and Forecasts To 2030 (US$ Thousand)
Figure 17. Beverages Market Revenue and Forecasts To 2030 (US$ Thousand)
Figure 18. Meat, Poultry, and Seafood Market Revenue and Forecasts To 2030 (US$ Thousand)
Figure 19. Meat Substitutes Market Revenue and Forecasts To 2030 (US$ Thousand)
Figure 20. Dairy Alternatives Market Revenue and Forecasts To 2030 (US$ Thousand)
Figure 21. RTE and RTC Meals Market Revenue and Forecasts To 2030 (US$ Thousand)
Figure 22. Other Food and Beverages Market Revenue and Forecasts To 2030 (US$ Thousand)
Figure 23. Pharmaceuticals and Nutraceuticals Market Revenue and Forecasts To 2030 (US$ Thousand)
Figure 24. Others Market Revenue and Forecasts To 2030 (US$ Thousand)
Figure 25. Flavor Masking Agents Market Breakdown by Geography, 2022 and 2030 (US$ Thousand)
Figure 26. North America Flavor Masking Agents Market Revenue and Forecasts To 2030 (US$ Thousand)
Figure 27. North America Flavor Masking Agents Market Breakdown by Type (2022 and 2030)
Figure 28. North America Flavor Masking Agents Market Breakdown by Application (2022 and 2030)
Figure 29. North America Flavor Masking Agents Market Breakdown by Key Countries, 2022 and 2030 (%)
Figure 30. US Flavor Masking Agents Market Revenue and Forecasts To 2030 (US$ Thousand)
Figure 31. Canada Flavor Masking Agents Market Revenue and Forecasts To 2030 (US$ Thousand)
Figure 32. Mexico Flavor Masking Agents Market Revenue and Forecasts To 2030 (US$ Thousand)
Figure 33. Europe Flavor Masking Agents Market Revenue and Forecasts To 2030 (US$ Thousand)
Figure 34. Europe Flavor Masking Agents Market Breakdown by Type (2022 and 2030)
Figure 35. Europe Flavor Masking Agents Market Breakdown by Application (2022 and 2030)
Figure 36. Europe Flavor Masking Agents Market Breakdown by Key Countries, 2022 and 2030 (%)
Figure 37. Germany Flavor Masking Agents Market Revenue and Forecasts To 2030 (US$ Thousand)
Figure 38. France Flavor Masking Agents Market Revenue and Forecasts To 2030 (US$ Thousand)
Figure 39. Italy Flavor Masking Agents Market Revenue and Forecasts To 2030 (US$ Thousand)
Figure 40. UK Flavor Masking Agents Market Revenue and Forecasts To 2030 (US$ Thousand)
Figure 41. Russia Flavor Masking Agents Market Revenue and Forecasts To 2030 (US$ Thousand)
Figure 42. Rest of Europe Flavor Masking Agents Market Revenue and Forecasts To 2030 (US$ Thousand)
Figure 43. Asia Pacific Flavor Masking Agents Market Revenue and Forecasts To 2030 (US$ Thousand)
Figure 44. Asia Pacific Flavor Masking Agents Market Breakdown by Type (2022 and 2030)
Figure 45. Asia Pacific Flavor Masking Agents Market Breakdown by Application (2022 and 2030)
Figure 46. Asia Pacific Flavor Masking Agents Market Breakdown By Key Countries, 2022 And 2030 (%)
Figure 47. China Flavor Masking Agents Market Revenue and Forecasts To 2030 (US$ Thousand)
Figure 48. Japan Flavor Masking Agents Market Revenue and Forecasts To 2030 (US$ Thousand)
Figure 49. India Flavor Masking Agents Market Revenue and Forecasts To 2030 (US$ Thousand)
Figure 50. Australia Flavor Masking Agents Market Revenue and Forecasts To 2030 (US$ Thousand)
Figure 51. South Korea Flavor Masking Agents Market Revenue and Forecasts To 2030 (US$ Thousand)
Figure 52. Rest of Asia Pacific Flavor Masking Agents Market Revenue and Forecasts To 2030 (US$ Thousand)
Figure 53. Middle East & Africa Flavor Masking Agents Market Revenue and Forecasts To 2030 (US$ Thousand)
Figure 54. Middle East & Africa Flavor Masking Agents Market Breakdown by Type (2022 and 2030)
Figure 55. Middle East & Africa Flavor Masking Agents Market Breakdown by Application (2022 and 2030)
Figure 56. Middle East & Africa Flavor Masking Agents Market Breakdown by Key Countries, 2022 and 2030 (%)
Figure 57. South Africa Flavor Masking Agents Market Revenue and Forecasts To 2030 (US$ Thousand)
Figure 58. Saudi Arabia Flavor Masking Agents Market Revenue and Forecasts To 2030 (US$ Thousand)
Figure 59. UAE Flavor Masking Agents Market Revenue and Forecasts To 2030 (US$ Thousand)
Figure 60. Rest of Middle East & Africa Flavor Masking Agents Market Revenue and Forecasts To 2030 (US$ Thousand)
Figure 61. South & Central America Flavor Masking Agents Market Revenue and Forecasts To 2030 (US$ Thousand)
Figure 62. South & Central America Flavor Masking Agents Market Breakdown by Type (2022 and 2030)
Figure 63. South & Central America Flavor Masking Agents Market Breakdown by Application (2022 and 2030)
Figure 64. South & Central Flavor Masking Agents Market Breakdown by Key Countries, 2022 and 2030 (%)
Figure 65. Brazil Flavor Masking Agents Market Revenue and Forecasts To 2030 (US$ Thousand)
Figure 66. Argentina Flavor Masking Agents Market Revenue and Forecasts To 2030 (US$ Thousand)
Figure 67. Rest of South & Central America Flavor Masking Agents Market Revenue and Forecasts To 2030 (US$ Thousand)
Figure 68. Pre & Post COVID-19 Impact: Flavor Masking Agents Market
Figure 69. Company Positioning & Concentration
The List of Companies - Flavor Masking Agents Market
- Sensient Technologies Corp
- Firmenich International SA
- Tate & Lyle Plc
- Archer-Daniels-Midland Co
- Kerry Group Plc
- Carmi Flavor & Fragrance Co Inc
- Synergy Flavors Inc
- Virginia Dare Extract Co Inc
- GEO Specialty Chemicals Inc
- Koninklijke DSM NV
The Insight Partners performs research in 4 major stages: Data Collection & Secondary Research, Primary Research, Data Analysis and Data Triangulation & Final Review.
- Data Collection and Secondary Research:
As a market research and consulting firm operating from a decade, we have published many reports and advised several clients across the globe. First step for any study will start with an assessment of currently available data and insights from existing reports. Further, historical and current market information is collected from Investor Presentations, Annual Reports, SEC Filings, etc., and other information related to company’s performance and market positioning are gathered from Paid Databases (Factiva, Hoovers, and Reuters) and various other publications available in public domain.
Several associations trade associates, technical forums, institutes, societies and organizations are accessed to gain technical as well as market related insights through their publications such as research papers, blogs and press releases related to the studies are referred to get cues about the market. Further, white papers, journals, magazines, and other news articles published in the last 3 years are scrutinized and analyzed to understand the current market trends.
- Primary Research:
The primarily interview analysis comprise of data obtained from industry participants interview and answers to survey questions gathered by in-house primary team.
For primary research, interviews are conducted with industry experts/CEOs/Marketing Managers/Sales Managers/VPs/Subject Matter Experts from both demand and supply side to get a 360-degree view of the market. The primary team conducts several interviews based on the complexity of the markets to understand the various market trends and dynamics which makes research more credible and precise.
A typical research interview fulfils the following functions:
- Provides first-hand information on the market size, market trends, growth trends, competitive landscape, and outlook
- Validates and strengthens in-house secondary research findings
- Develops the analysis team’s expertise and market understanding
Primary research involves email interactions and telephone interviews for each market, category, segment, and sub-segment across geographies. The participants who typically take part in such a process include, but are not limited to:
- Industry participants: VPs, business development managers, market intelligence managers and national sales managers
- Outside experts: Valuation experts, research analysts and key opinion leaders specializing in the electronics and semiconductor industry.
Below is the breakup of our primary respondents by company, designation, and region:

Once we receive the confirmation from primary research sources or primary respondents, we finalize the base year market estimation and forecast the data as per the macroeconomic and microeconomic factors assessed during data collection.
- Data Analysis:
Once data is validated through both secondary as well as primary respondents, we finalize the market estimations by hypothesis formulation and factor analysis at regional and country level.
- 3.1 Macro-Economic Factor Analysis:
We analyse macroeconomic indicators such the gross domestic product (GDP), increase in the demand for goods and services across industries, technological advancement, regional economic growth, governmental policies, the influence of COVID-19, PEST analysis, and other aspects. This analysis aids in setting benchmarks for various nations/regions and approximating market splits. Additionally, the general trend of the aforementioned components aid in determining the market's development possibilities.
- 3.2 Country Level Data:
Various factors that are especially aligned to the country are taken into account to determine the market size for a certain area and country, including the presence of vendors, such as headquarters and offices, the country's GDP, demand patterns, and industry growth. To comprehend the market dynamics for the nation, a number of growth variables, inhibitors, application areas, and current market trends are researched. The aforementioned elements aid in determining the country's overall market's growth potential.
- 3.3 Company Profile:
The “Table of Contents” is formulated by listing and analyzing more than 25 - 30 companies operating in the market ecosystem across geographies. However, we profile only 10 companies as a standard practice in our syndicate reports. These 10 companies comprise leading, emerging, and regional players. Nonetheless, our analysis is not restricted to the 10 listed companies, we also analyze other companies present in the market to develop a holistic view and understand the prevailing trends. The “Company Profiles” section in the report covers key facts, business description, products & services, financial information, SWOT analysis, and key developments. The financial information presented is extracted from the annual reports and official documents of the publicly listed companies. Upon collecting the information for the sections of respective companies, we verify them via various primary sources and then compile the data in respective company profiles. The company level information helps us in deriving the base number as well as in forecasting the market size.
- 3.4 Developing Base Number:
Aggregation of sales statistics (2020-2022) and macro-economic factor, and other secondary and primary research insights are utilized to arrive at base number and related market shares for 2022. The data gaps are identified in this step and relevant market data is analyzed, collected from paid primary interviews or databases. On finalizing the base year market size, forecasts are developed on the basis of macro-economic, industry and market growth factors and company level analysis.
- Data Triangulation and Final Review:
The market findings and base year market size calculations are validated from supply as well as demand side. Demand side validations are based on macro-economic factor analysis and benchmarks for respective regions and countries. In case of supply side validations, revenues of major companies are estimated (in case not available) based on industry benchmark, approximate number of employees, product portfolio, and primary interviews revenues are gathered. Further revenue from target product/service segment is assessed to avoid overshooting of market statistics. In case of heavy deviations between supply and demand side values, all thes steps are repeated to achieve synchronization.
We follow an iterative model, wherein we share our research findings with Subject Matter Experts (SME’s) and Key Opinion Leaders (KOLs) until consensus view of the market is not formulated – this model negates any drastic deviation in the opinions of experts. Only validated and universally acceptable research findings are quoted in our reports.
We have important check points that we use to validate our research findings – which we call – data triangulation, where we validate the information, we generate from secondary sources with primary interviews and then we re-validate with our internal data bases and Subject matter experts. This comprehensive model enables us to deliver high quality, reliable data in shortest possible time.
Trends and growth analysis reports related to Flavor Masking Agents Market

Nov 2023
Corn and Wheat-Based Feed Market
Size and Forecast (2020 - 2030), Global and Regional Share, Trend, and Growth Opportunity Analysis Report Coverage: By Product Type [Corn-Based (Corn Gluten Meal, Corn Gluten Feed, and Other Corn-Based Feed) and Wheat-Based (Wheat Gluten, Wheat Bran, and Other Wheat-Based Feed)], Livestock (Poultry, Ruminants, Swine, Aquaculture, and Others), and Geography
Nov 2023
Icing and Frosting Market
Size and Forecasts (2020 - 2030), Global and Regional Share, Trend, and Growth Opportunity Analysis Report Coverage: By Type (Icing and Frosting), Category (Gluten-Free and Conventional), Distribution Channel (Supermarkets and Hypermarkets, Specialty Stores, Online Retail, and Others), and Geography
Nov 2023
Fermented Flavor and Fragrance Ingredients Market
Size and Forecast (2020 - 2030), Global and Regional Share, Trend, and Growth Opportunity Analysis Report Coverage: By Type (Fruity, Floral, Woody, Blends, and Others), Application (Food and Beverages, Personal Care Products, Cosmetics, and Others), and Geography
Nov 2023
Aroma Ingredients for Food and Beverages Market
Size and Forecast (2020 - 2030), Global and Regional Share, Trend, and Growth Opportunity Analysis Report Coverage: By Type [Synthetic (Terpenes, Aldehydes, Aliphatic, and Others) and Natural (Essential Oils, Herbal Extracts, Oleoresins, and Others)] and Application (Bakery and Confectionery, Dairy and Frozen Desserts, Beverages, Sweet and Savory Snacks, RTE and RTC Meals, and Others)
Nov 2023
High-End Rum Market
Size and Forecasts (2020 - 2030), Global and Regional Share, Trend, and Growth Opportunity Analysis Report Coverage: By Product Type (White, Dark, and Gold), Category (Super Premium, Ultra-Premium, and Prestige & Prestige Plus), Nature (Plain and Flavored), and Distribution Channel (Supermarkets and Hypermarkets, Specialty Stores, Online Retail, and Others)
Nov 2023
Edible Oils and Fats Market
Size and Forecasts (2020 - 2030), Global and Regional Share, Trends, and Growth Opportunity Analysis Report Coverage: By Type [Oil (Soybean Oil, Sunflower Oil, Palm Oil, Canola Oil/Rapeseed Oil, and Others) and Fats (Butter, Margarine, Palm Oil Based Shortening, and Vegetable Oil Based Shortening, and Others)] and Application [Food and Beverages (Bakery and Confectionery, Dairy and Frozen Desserts, RTE and RTC Meals, Snacks, and Others), Animal Nutrition, and Pharmaceuticals and Nutraceuticals]
Nov 2023
Flavor Masking Agents for Food and Beverages Market
Size and Forecasts (2020 - 2030), Global and Regional Share, Trends, and Growth Opportunity Analysis Report Coverage: By Type (Sweet, Salt, Fat, Bitter, and Others) and Application (Bakery and Confectionery; Dairy and Frozen Desserts; Beverages; Meat, Poultry, and Seafood; Meat Substitutes; Dairy Alternatives; RTE and RTC Meals; and Others)
Nov 2023
Chicken Powder Market
Size and Forecasts (2020 - 2030), Global and Regional Share, Trends, and Growth Opportunity Analysis Report Coverage: By Type (Low-Fat and Conventional) and Application [Food & Beverages (RTE and RTC Meals; Soups, Sauces, and Dressings; Savory Snacks; Noodles and Pastas; and Others), Dietary Supplements, Pet Food, and Animal Feed]