$4550
$3640
[Research Report] The E-Bike market is expected to grow from US$ 39,660.1 Million in 2022 to US$ 1,08,604.6 Million by 2030. The E-Bike market is estimated to register a CAGR of 13.4% from 2022 to 2030.
E-Bike Market Analyst Perspective:
Increased Fuel Costs and Rising Adoption of Environment-Friendly Transportation Drives Market Growth
The high fuel cost and rising demand for affordable transportation have fueled the market demand for e-bikes. The average price of gasoline worldwide is USD 3.32 per gallon in 2023, projected to reach USD 3.79 per gallon by 2025 and USD 5 per gallon by 2030 for regular gasoline. With the surge in consumer awareness towards environmentally friendly transportation, such an increase in fuel pricing around the globe is driving the market growth. According to the United Nations Organization Report in 2021, the annual investment for sustainable transportation was valued at USD 1.4 to USD 2.1 trillion. This spending involves electric vehicle manufacturing, charging stations, and e-bike production. Air pollution is a major environmental concern that is increasing rapidly.
Several countries' governments have planned to provide subsidies for clean and green transportation to reduce air pollution. The global cost of air pollution reached USD 2.9 trillion, 3.3% of the global GDP. Also, air pollution costs at least USD 95 in India, which can be reduced by adopting bicycles and e-bike trips. Cycling using e-bikes worldwide has increased the ability to travel short distances. Adopting e-bike and cycling usage can reduce 2 Giga tonnes of CO2 emissions annually. At the global level, cycling and e-bike usage can reduce an additional USD 836 billion annually. Thus, to reduce the cost of pollution, the demand for environment-friendly transportation has increased.
Also, the key players are investing a considerable amount to meet the global e-bike demand. For instance, in January 2022, Cowboy, a German-based e-bike manufacturer, received an investment of USD 80 million to expand its manufacturing facilities. Further, in March 2023, the U.K. transport department announced a USD 2 billion plan to boost cycling and walking during and after the lockdown. The country’s government announced USD 200 million for new active travel schemes across England, including USD 35 million for the National Cycle Network and USD 8 million for the new e-cycle program. Similarly, Rad Power Bikes raised around USD 300 million in two rounds in 2021, focusing on increasing production capacity outside the Asia Pacific region.
E-Bike Market Overview:
E-Bike uses control systems, such as robots, computers, and information technologies, to handle various machinery in an industry to replace human intervention. Depending on the operations involved, the E-Bike systems are majorly classified into two types, namely process plant automation and manufacturing automation. E-Bike offers high product quality, reliability, and production rate while reducing production and design costs by deploying new, innovative, and integrated technologies and services. They possess various features, such as high productivity, quality, flexibility, and information accuracy, which are likely to increase the uptake of automation in the industrial sector during the forecast period. Also, the surge in the uptake of automation solutions in the oil & gas, manufacturing, chemicals & materials, pharmaceuticals, and other industries is driving the e-bike market
Customize Research To Suit Your Requirement
We can optimize and tailor the analysis and scope which is unmet through our standard offerings. This flexibility will help you gain the exact information needed for your business planning and decision making.
E-Bike Market: Strategic Insights
Market Size Value in US$ 39,660.1 Million in 2022 Market Size Value by US$ 1,08,604.6 Million by 2030 Growth rate CAGR of 13.4% from 2022 to 2030 Forecast Period 2022-2030 Base Year 2022

Naveen
Have a question?
Naveen will walk you through a 15-minute call to present the report’s content and answer all queries if you have any.
 Speak to Analyst
Customize Research To Suit Your Requirement
We can optimize and tailor the analysis and scope which is unmet through our standard offerings. This flexibility will help you gain the exact information needed for your business planning and decision making.
E-Bike Market: Strategic Insights
| Market Size Value in | US$ 39,660.1 Million in 2022 |
| Market Size Value by | US$ 1,08,604.6 Million by 2030 |
| Growth rate | CAGR of 13.4% from 2022 to 2030 |
| Forecast Period | 2022-2030 |
| Base Year | 2022 |
Naveen
Have a question?
Naveen will walk you through a 15-minute call to present the report’s content and answer all queries if you have any.
Speak to Analyst
Market Driver:
Government Support to Lower the Carbon Emission Boost the Demand for E-Bikes Market Growth
Several countries' governments are launching incentive programs to promote e-bike and electric vehicle sales to reduce carbon footprints. For instance, the U.S. government launched the Electric Bike Incentive Kickstart for the Environment (E-BIKE) Act Scheme, which offers a subsidy of up to 30% of the cost of an electric bike. The incentive program involves incentives up to USD 300 on an e-bike, whereas up to US 500 on a cargo bike for lower-income residents. In May 2019, the Canadian government incentivized people to purchase electric bikes by offering a cash discount from USD 250 to USD 750.
Further, European countries are well-equipped with several incentive government schemes to promote the use of e-bike users. The European Cyclists’ Federation (ECF) offers various subsidies based on the type of E-bike purchased by target groups, including businesses, individuals, and public entities. For instance, in France, as of August 2022, residents with an annual income of USD 14,592.40 or less receive a USD 325 discount on purchasing E-bikes. Also, residents with an annual income of USD 6,800 or less and those with proof of disability may receive a discount up to USD 435.
Similarly, the Chinese and Indian governments are promoting subsidy schemes to promote electric vehicle sales to reduce carbon footprints. For instance, the Ministry of Finance and Ministry of Commerce in China offer the maximum subsidy for e-bikes in rural areas up to USD 36 per vehicle, with 80% of subsidies from the central government’s budget and 20% from the provincial budget. In India, as per the government subsidy program on E-bikes, the government offers subsidies of up to 25% of the overall e-bike cost with a maximum purchase incentive of up to USD 65. The government also planned a fixed additional incentive of USD 25 for the first 10,000 e-bikes, apart from other subsidies and bonuses.
Report Segmentation and Scope:
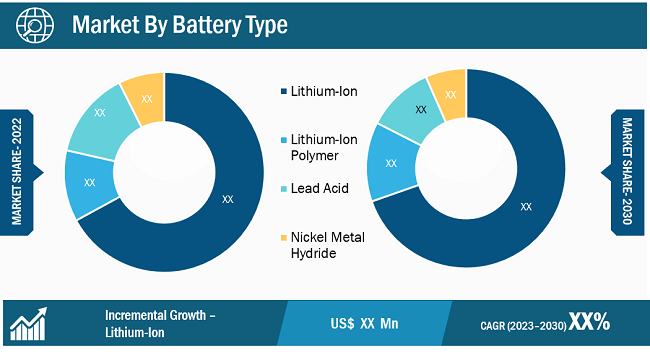
The E-Bike market is segmented on the basis of battery type, motor type, class, mode, and geography. Based on battery type, the global e-bike market is segmented into lithium-ion, lithium-ion polymer, lead acid, and nickel metal hydride. Depending on the motor type, the market is divided into hub motor and mid-motor. Based on class, the market is segmented into class I, class II, and class III. Based on the mode, the market is divided into pedal assist mode and throttle mode. Based on geography, it is segmented into North America, Europe, Asia Pacific, Middle East & Africa, and South America.
- Sample PDF showcases the content structure and the nature of the information with qualitative and quantitative analysis.
- Request discounts available for Start-Ups & Universities
Segmental Analysis:
Based on battery type, the E-Bike market is bifurcated into:
- Lithium-Ion
- Lithium-Ion Polymer
- Lead Acid
- Nickel Metal Hydride
The lithium-ion segment held a larger E-Bike market share in 2022 and is anticipated to register a moderate CAGR in the market during the forecast period. Lithium-ion is a major component of electric bicycle manufacturing and contributes around 40% of the total vehicle cost. Globally, the demand for lithium batteries in E-bikes will increase by 60-70% since 2020, owing to a growing consumer awareness surge in government support and initiatives. Also, over 80% of bike-sharing companies use lithium batteries. Li-ion batteries are still relatively expensive to produce, primarily due to the high costs of raw materials and manufacturing processes.
- Sample PDF showcases the content structure and the nature of the information with qualitative and quantitative analysis.
- Request discounts available for Start-Ups & Universities
Regional Analysis:
The E-Bike market is broadly segmented into five major regions—North America, Europe, Asia Pacific (APAC), Middle East & Africa (MEA), and South America. Asia Pacific held the largest E-Bike market share in 2022, followed by Europe and North America. Further, North America is expected to register the highest CAGR in the market during the forecast period.
In Asia Pacific, China is the world's largest consumer and exporter of electric bicycles. In China, more than 300 million electric bicycles are being used. In 2020, China produced around 41.3 million electric bicycles and exported more than 2.0 million worldwide. In China, more than 50 million people use e-bikes owing to their low cost, convenience, and relatively energy-efficient transportation. China is the dominant country that uses e-bikes as a travel mode.
Further, Japan and India are growing rapidly due to rising government schemes and funding to promote e-bike penetration. For instance, in March 2020, India’s finance minister launched the PLI scheme that provides subsidies for the e-cycles. The government announced an investment of USD 0.24 million for creating national manufacturing facilities. The scheme was introduced to promote the production of E-bikes and E.V.s to meet the local demand.
Key Player Analysis:
The key E-Bike market players profiled in the report are Haibike, Aventon Bikes; Giant Manufacturing Co Ltd; Merida Industry Co., Ltd.; Pedego Electric Bikes; Robert Bosch GmbH; Specialized Bicycle Components, Inc.; Shimano Inc.; Trek Bicycle Corp.; and Yamaha Motor Co Ltd; are the top E-Bike market players as they offer diversified product portfolios.
Recent Developments:
Key Players in the market are adopting several strategies, including product launching, mergers & acquisitions, partnerships and collaborations with local players. For instance,
- In 2023, Hitachi's strategic merger of Hitachi Automation and Kyoto Robotics aimed to enhance the company's robotic systems integration prowess in Japanese and Asian markets. This move facilitated comprehensive solutions for manufacturing and logistics automation, capitalizing on Hitachi's digital solutions and Kyoto Robotics' intelligent vision systems. This merger underlines the growing emphasis on advanced automation in industry.
- In 2023, Mitsubishi Electric's strategic investment in Clearpath Robotics marked a significant move in advancing e-bikes. The investment aimed to enhance complete factory optimization through autonomous mobile robots (AMR), showcasing the commitment to open innovation and fostering manufacturing automation's growth.
- In March 2023, Decathlon, India’s e-sport goods brand, launched the Rockrider E-ST100 bicycle. This e-bike has pedal assistance and lithium-ion batteries. The company introduced 150 units of e-cycles across India.
- In January 2022, the VAAN Electric Moto E-mobility company launched electric bikes in India. The e-bike is built with lithium-ion batteries available in Urbansport and Urbansport Pro.
- In August 2023, Virtus Motors, an India-based electric mobility manufacturer, launched electric cycles with a 250-watt hub motor and an in-built LCD.
- June 2023 - The Hyundai launched Rayvolt Exxcite electric bicycle for France. Hyundai entered into the e-mobility market. Hyundai and Rayvolt are working to create a special edition of the well-known Exxite Next generation e-bike. The Hyundai Exxcite has a 250-watt EPAC hub motor with a torque of 50 Nm. Its top assisted speed is 16mph, and it is built with a torque sensor to ensure seamless and smooth power deliveries.
- In February 2023, The Aventon Abound launched as a high-quality addition to the growing electric cargo bikes. The e-cargo bike is coupled with a 750-watt rear-geared hub motor.
- In January 2023, eBikeGo, an India-based electric two-wheeler mobility platform, launched an electric bicycle product named Transil e1. Transil brand eBikeGo aimed to produce effective, modern, and sustainable e-bikes for consumers.
- In January 2022, TVS Group Company acquired 75% of the e-bike manufacturer in Europe Swiss E-Mobility Group (SEMG) for USD 100 million. With this acquisition, the company planned to enter the European market to supply its e-bike under the TVS company brand.

Report Coverage
Revenue forecast, Company Analysis, Industry landscape, Growth factors, and Trends

Segment Covered
Battery Type, Motor Type, Class, Mode

Regional Scope
North America, Europe, Asia Pacific, Middle East & Africa, South & Central America

Country Scope
This text is related
to country scope.
Frequently Asked Questions
The global market size of e-bike market by 2028 will be around US$ 1,08,604.6 million
China is expected to hold a major market share of e-bike market in 2022
Haibike, Gaint Manufacturing Ltd., Merida Industry Co. Ltd., Rober Bosch GmbH, and Yamaha Motor Co. Ltd. are the key market players expected to hold a major market share of e-bike market in 2022
The e-bike market is expected to register an incremental growth value of US$ 68,944.48 million during the forecast period
1. Increased fuel costs and rising adoption of environment-friendly transportation drives market growth
2. Growth of outdoor sports and adventurous activities strengthen the market growth
North America is expected to register highest CAGR in the e-bike market during the forecast period (2022-2028)
The estimated global market size for the e-bike market in 2022 is expected to be around US$ 39,660.1 million
India, US, China, and South Korea are expected to register high growth rate during the forecast period
Development of lightweight material-based e-bikes with advanced features
Lithium-ion segment is expected to hold a major market share of e-bike market in 2022
1. Introduction
1.1 The Insight Partners Research Report Guidance
1.2 Market Segmentation
2. Executive Summary
2.1 Key Insights
2.2 Market Attractiveness
3. Research Methodology
3.1 Coverage
3.2 Secondary Research
3.3 Primary Research
4. E-Bike Market Landscape
4.1 Overview
4.2 PEST Analysis
4.3 Ecosystem Analysis
4.3.1 List of E-Bike Suppliers
5. E-Bike Market - Key Industry Dynamics
5.1 E-Bike Market - Key Industry Dynamics
5.2 Market Drivers
5.2.1 Growth of Outdoor Sports and Adventurous Activities
5.2.2 Government Support to Lower Carbon Emissions Transportation
5.2.3 Increasing Prices of Fuel and Rising Adoption of Environment-Friendly Transportation
5.3 Market Restraints
5.3.1 High Cost of E-Bikes and Requirement of Huge Capital Investments in Their Manufacturing
5.4 Market Opportunities
5.4.1 Rising Adoption of Connected E-Bikes Among Business and Government Sectors
5.5 Future Trends
5.5.1 Development of E-Bikes Using Lightweight Material and Advanced Smart Systems
5.6 Impact of Drivers and Restraints:
6. E-Bike Market - Global Market Analysis
6.1 E-Bike Market Revenue (US$ Million), 2022 – 2030
6.2 E-Bike Market Forecast and Analysis
7. E-Bike Market Analysis – Battery Type
7.1 Lithium-Ion
7.1.1 Overview
7.1.2 Lithium-Ion Market, Revenue and Forecast to 2030 (US$ Million)
7.2 Lithium-Ion Polymer
7.2.1 Overview
7.2.2 Lithium-Ion Polymer Market, Revenue and Forecast to 2030 (US$ Million)
7.3 Lead Acid
7.3.1 Overview
7.3.2 Lead Acid Market, Revenue and Forecast to 2030 (US$ Million)
7.4 Nickel Metal Hydride
7.4.1 Overview
7.4.2 Nickel Metal Hydride Market, Revenue and Forecast to 2030 (US$ Million)
8. E-Bike Market Analysis – Motor Type
8.1 Mid Motor
8.1.1 Overview
8.1.2 Mid Motor Market Revenue, and Forecast to 2030 (US$ Million)
8.2 Hub Motor
8.2.1 Overview
8.2.2 Hub Motor Market Revenue, and Forecast to 2030 (US$ Million)
9. E-Bike Market Analysis – Class
9.1 Class I
9.1.1 Overview
9.1.2 Class I Market Revenue, and Forecast to 2030 (US$ Million)
9.2 Class II
9.2.1 Overview
9.2.2 Class II Market Revenue, and Forecast to 2030 (US$ Million)
9.3 Class III
9.3.1 Overview
9.3.2 Class III Market Revenue, and Forecast to 2030 (US$ Million)
10. E-Bike Market Analysis – Mode
10.1 Pedal Assisted Mode
10.1.1 Overview
10.1.2 Pedal Assisted Mode Market Revenue, and Forecast to 2030 (US$ Million)
10.2 Throttle Mode
10.2.1 Overview
10.2.2 Throttle Mode Market Revenue, and Forecast to 2030 (US$ Million)
11. E-Bike Market - Geographical Analysis
11.1 Overview
11.2 North America
11.2.1 North America E-Bike Market Overview
11.2.2 North America E-Bike Market Revenue and Forecasts to 2030 (US$ Mn)
11.2.3 North America E-Bike Market Breakdown by Battery Type
11.2.3.1 North America E-Bike Market Revenue and Forecasts and Analysis - By Battery Type
11.2.4 North America E-Bike Market Breakdown by Motor Type
11.2.4.1 North America E-Bike Market Revenue and Forecasts and Analysis - By Motor Type
11.2.5 North America E-Bike Market Breakdown by Class
11.2.5.1 North America E-Bike Market Revenue and Forecasts and Analysis - By Class
11.2.6 North America E-Bike Market Breakdown by Mode
11.2.6.1 North America E-Bike Market Revenue and Forecasts and Analysis - By Mode
11.2.7 North America E-Bike Market Revenue and Forecasts and Analysis - By Country
11.2.7.1 North America E-Bike Market Revenue and Forecasts and Analysis - By Country
11.2.7.2 US E-Bike Market Revenue and Forecasts to 2030 (US$ Mn)
11.2.7.2.1 US E-Bike Market Breakdown by Battery Type
11.2.7.2.2 US E-Bike Market Breakdown by Motor Type
11.2.7.2.3 US E-Bike Market Breakdown by Class
11.2.7.2.4 US E-Bike Market Breakdown by Mode
11.2.7.3 Canada E-Bike Market Revenue and Forecasts to 2030 (US$ Mn)
11.2.7.3.1 Canada E-Bike Market Breakdown by Battery Type
11.2.7.3.2 Canada E-Bike Market Breakdown by Motor Type
11.2.7.3.3 Canada E-Bike Market Breakdown by Class
11.2.7.3.4 Canada E-Bike Market Breakdown by Mode
11.2.7.4 Mexico E-Bike Market Revenue and Forecasts to 2030 (US$ Mn)
11.2.7.4.1 Mexico E-Bike Market Breakdown by Battery Type
11.2.7.4.2 Mexico E-Bike Market Breakdown by Motor Type
11.2.7.4.3 Mexico E-Bike Market Breakdown by Class
11.2.7.4.4 Mexico E-Bike Market Breakdown by Mode
11.3 Europe
11.3.1 Europe E-Bike Market Overview
11.3.2 Europe E-Bike Market Revenue and Forecasts to 2030 (US$ Mn)
11.3.3 Europe E-Bike Market Breakdown by Battery Type
11.3.3.1 Europe E-Bike Market Revenue and Forecasts and Analysis - By Battery Type
11.3.4 Europe E-Bike Market Breakdown by Motor Type
11.3.4.1 Europe E-Bike Market Revenue and Forecasts and Analysis - By Motor Type
11.3.5 Europe E-Bike Market Breakdown by Class
11.3.5.1 Europe E-Bike Market Revenue and Forecasts and Analysis - By Class
11.3.6 Europe E-Bike Market Breakdown by Mode
11.3.6.1 Europe E-Bike Market Revenue and Forecasts and Analysis - By Mode
11.3.7 Europe E-Bike Market Revenue and Forecasts and Analysis - By Country
11.3.7.1 Europe E-Bike Market Revenue and Forecasts and Analysis - By Country
11.3.7.2 Germany E-Bike Market Revenue and Forecasts to 2030 (US$ Mn)
11.3.7.2.1 Germany E-Bike Market Breakdown by Battery Type
11.3.7.2.2 Germany E-Bike Market Breakdown by Motor Type
11.3.7.2.3 Germany E-Bike Market Breakdown by Class
11.3.7.2.4 Germany E-Bike Market Breakdown by Mode
11.3.7.3 France E-Bike Market Revenue and Forecasts to 2030 (US$ Mn)
11.3.7.3.1 France E-Bike Market Breakdown by Battery Type
11.3.7.3.2 France E-Bike Market Breakdown by Motor Type
11.3.7.3.3 France E-Bike Market Breakdown by Class
11.3.7.3.4 France E-Bike Market Breakdown by Mode
11.3.7.4 Italy E-Bike Market Revenue and Forecasts to 2030 (US$ Mn)
11.3.7.4.1 Italy E-Bike Market Breakdown by Battery Type
11.3.7.4.2 Italy E-Bike Market Breakdown by Motor Type
11.3.7.4.3 Italy E-Bike Market Breakdown by Class
11.3.7.4.4 Italy E-Bike Market Breakdown by Mode
11.3.7.5 UK E-Bike Market Revenue and Forecasts to 2030 (US$ Mn)
11.3.7.5.1 UK E-Bike Market Breakdown by Battery Type
11.3.7.5.2 UK E-Bike Market Breakdown by Motor Type
11.3.7.5.3 UK E-Bike Market Breakdown by Class
11.3.7.5.4 UK E-Bike Market Breakdown by Mode
11.3.7.6 Netherland E-Bike Market Revenue and Forecasts to 2030 (US$ Mn)
11.3.7.6.1 Netherland E-Bike Market Breakdown by Battery Type
11.3.7.6.2 Netherland E-Bike Market Breakdown by Motor Type
11.3.7.6.3 Netherland E-Bike Market Breakdown by Class
11.3.7.6.4 Netherland E-Bike Market Breakdown by Mode
11.3.7.7 Rest of Europe E-Bike Market Revenue and Forecasts to 2030 (US$ Mn)
11.3.7.7.1 Rest of Europe E-Bike Market Breakdown by Battery Type
11.3.7.7.2 Rest of Europe E-Bike Market Breakdown by Motor Type
11.3.7.7.3 Rest of Europe E-Bike Market Breakdown by Class
11.3.7.7.4 Rest of Europe E-Bike Market Breakdown by Mode
11.4 Asia Pacific E-Bike Market
11.4.1 Overview
11.4.2 Asia Pacific E-Bike Market Revenue and Forecasts to 2030 (US$ Mn)
11.4.3 Asia Pacific E-Bike Market Breakdown by Battery Type
11.4.3.1 Asia Pacific E-Bike Market Revenue and Forecasts and Analysis - By Battery Type
11.4.4 Asia Pacific E-Bike Market Breakdown by Motor Type
11.4.4.1 Asia Pacific E-Bike Market Revenue and Forecasts and Analysis - By Motor Type
11.4.5 Asia Pacific E-Bike Market Breakdown by Class
11.4.5.1 Asia Pacific E-Bike Market Revenue and Forecasts and Analysis - By Class
11.4.6 Asia Pacific E-Bike Market Breakdown by Mode
11.4.6.1 Asia Pacific E-Bike Market Revenue and Forecasts and Analysis - By Mode
11.4.7 Asia Pacific E-Bike Market Revenue and Forecasts and Analysis - By Country
11.4.7.1 Asia Pacific E-Bike Market Revenue and Forecasts and Analysis - By Country
11.4.7.2 Australia E-Bike Market Revenue and Forecasts to 2030 (US$ Mn)
11.4.7.2.1 Australia E-Bike Market Breakdown by Battery Type
11.4.7.2.2 Australia E-Bike Market Breakdown by Motor Type
11.4.7.2.3 Australia E-Bike Market Breakdown by Class
11.4.7.2.4 Australia E-Bike Market Breakdown by Mode
11.4.7.3 China E-Bike Market Revenue and Forecasts to 2030 (US$ Mn)
11.4.7.3.1 China E-Bike Market Breakdown by Battery Type
11.4.7.3.2 China E-Bike Market Breakdown by Motor Type
11.4.7.3.3 China E-Bike Market Breakdown by Class
11.4.7.3.4 China E-Bike Market Breakdown by Mode
11.4.7.4 India E-Bike Market Revenue and Forecasts to 2030 (US$ Mn)
11.4.7.4.1 India E-Bike Market Breakdown by Battery Type
11.4.7.4.2 India E-Bike Market Breakdown by Motor Type
11.4.7.4.3 India E-Bike Market Breakdown by Class
11.4.7.4.4 India E-Bike Market Breakdown by Mode
11.4.7.5 Japan E-Bike Market Revenue and Forecasts to 2030 (US$ Mn)
11.4.7.5.1 Japan E-Bike Market Breakdown by Battery Type
11.4.7.5.2 Japan E-Bike Market Breakdown by Motor Type
11.4.7.5.3 Japan E-Bike Market Breakdown by Class
11.4.7.5.4 Japan E-Bike Market Breakdown by Mode
11.4.7.6 South Korea E-Bike Market Revenue and Forecasts to 2030 (US$ Mn)
11.4.7.6.1 South Korea E-Bike Market Breakdown by Battery Type
11.4.7.6.2 South Korea E-Bike Market Breakdown by Motor Type
11.4.7.6.3 South Korea E-Bike Market Breakdown by Class
11.4.7.6.4 South Korea E-Bike Market Breakdown by Mode
11.4.7.7 Rest of Asia Pacific E-Bike Market Revenue and Forecasts to 2030 (US$ Mn)
11.4.7.7.1 Rest of Asia Pacific E-Bike Market Breakdown by Battery Type
11.4.7.7.2 Rest of Asia Pacific E-Bike Market Breakdown by Motor Type
11.4.7.7.3 Rest of Asia Pacific E-Bike Market Breakdown by Class
11.4.7.7.4 Rest of Asia Pacific E-Bike Market Breakdown by Mode
11.5 Middle East & Africa
11.5.1 Middle East & Africa E-Bike Market Overview
11.5.2 Middle East & Africa E-Bike Market Revenue and Forecasts to 2030 (US$ Mn)
11.5.3 Middle East & Africa E-Bike Market Breakdown by Battery Type
11.5.3.1 Middle East & Africa E-Bike Market Revenue and Forecasts and Analysis - By Battery Type
11.5.4 Middle East & Africa E-Bike Market Breakdown by Motor Type
11.5.4.1 Middle East & Africa E-Bike Market Revenue and Forecasts and Analysis - By Motor Type
11.5.5 Middle East & Africa E-Bike Market Breakdown by Class
11.5.5.1 Middle East & Africa E-Bike Market Revenue and Forecasts and Analysis - By Class
11.5.5.2 Middle East & Africa E-Bike Market Revenue and Forecasts and Analysis - By Mode
11.5.6 Middle East & Africa E-Bike Market Revenue and Forecasts and Analysis - By Country
11.5.6.1 Middle East & Africa E-Bike Market Revenue and Forecasts and Analysis - By Country
11.5.6.2 UAE E-Bike Market Revenue and Forecasts to 2030 (US$ Mn)
11.5.6.2.1 UAE E-Bike Market Breakdown by Battery Type
11.5.6.2.2 UAE E-Bike Market Breakdown by Motor Type
11.5.6.2.3 UAE E-Bike Market Breakdown by Class
11.5.6.2.4 UAE E-Bike Market Breakdown by Mode
11.5.6.3 Saudi Arabia E-Bike Market Revenue and Forecasts to 2030 (US$ Mn)
11.5.6.3.1 Saudi Arabia E-Bike Market Breakdown by Battery Type
11.5.6.3.2 Saudi Arabia E-Bike Market Breakdown by Motor Type
11.5.6.3.3 Saudi Arabia E-Bike Market Breakdown by Class
11.5.6.3.4 Saudi Arabia E-Bike Market Breakdown by Mode
11.5.6.4 South Africa E-Bike Market Revenue and Forecasts to 2030 (US$ Mn)
11.5.6.4.1 South Africa E-Bike Market Breakdown by Battery Type
11.5.6.4.2 South Africa E-Bike Market Breakdown by Motor Type
11.5.6.4.3 South Africa E-Bike Market Breakdown by Class
11.5.6.4.4 South Africa E-Bike Market Breakdown by Mode
11.5.6.5 Rest of MEA E-Bike Market Revenue and Forecasts to 2030 (US$ Mn)
11.5.6.5.1 Rest of MEA E-Bike Market Breakdown by Battery Type
11.5.6.5.2 Rest of MEA E-Bike Market Breakdown by Motor Type
11.5.6.5.3 Rest of MEA E-Bike Market Breakdown by Class
11.5.6.5.4 Rest of MEA E-Bike Market Breakdown by Mode
11.6 South America
11.6.1 South America E-Bike Market Overview
11.6.2 South America E-Bike Market Revenue and Forecasts to 2030 (US$ Mn)
11.6.3 South America E-Bike Market Breakdown by Battery Type
11.6.3.1 South America E-Bike Market Revenue and Forecasts and Analysis - By Battery Type
11.6.4 South America E-Bike Market Breakdown by Motor Type
11.6.4.1 South America E-Bike Market Revenue and Forecasts and Analysis - By Motor Type
11.6.5 South America E-Bike Market Breakdown by Class
11.6.5.1 South America E-Bike Market Revenue and Forecasts and Analysis - By Class
11.6.6 South America E-Bike Market Breakdown by Mode
11.6.6.1 South America E-Bike Market Revenue and Forecasts and Analysis - By Mode
11.6.7 South America E-Bike Market Revenue and Forecasts and Analysis - By Countries
11.6.7.1 Brazil E-Bike Market Revenue and Forecasts to 2030 (US$ Mn)
11.6.7.1.1 Brazil E-Bike Market Breakdown by Battery Type
11.6.7.1.2 Brazil E-Bike Market Breakdown by Motor Type
11.6.7.1.3 Brazil E-Bike Market Breakdown by Class
11.6.7.1.4 Brazil E-Bike Market Breakdown by Mode
11.6.7.2 Argentina E-Bike Market Revenue and Forecasts to 2030 (US$ Mn)
11.6.7.2.1 Argentina E-Bike Market Breakdown by Battery Type
11.6.7.2.2 Argentina E-Bike Market Breakdown by Motor Type
11.6.7.2.3 Argentina E-Bike Market Breakdown by Class
11.6.7.2.4 Argentina E-Bike Market Breakdown by Mode
11.6.7.3 Rest of SAM E-Bike Market Revenue and Forecasts to 2030 (US$ Mn)
11.6.7.3.1 Rest of SAM E-Bike Market Breakdown by Battery Type
11.6.7.3.2 Rest of SAM E-Bike Market Breakdown by Motor Type
11.6.7.3.3 Rest of SAM E-Bike Market Breakdown by Class
11.6.7.3.4 Rest of SAM E-Bike Market Breakdown by Mode
12. E-Bike Market – Impact of COVID-19 Pandemic
12.1 Pre & Post Covid-19 Impact
13. Competitive Landscape
13.1 Heat Map Analysis by Key Players
13.2 Company Positioning & Concentration
14. Industry Landscape
14.1 Overview
14.2 Market Initiative
14.3 New Product Development
14.4 Merger and Acquisition
15. Company Profiles
15.1 Haibike
15.1.1 Key Facts
15.1.2 Business Description
15.1.3 Products and Services
15.1.4 Financial Overview
15.1.5 SWOT Analysis
15.1.6 Key Developments
15.2 Aventon Bikes
15.2.1 Key Facts
15.2.2 Business Description
15.2.3 Products and Services
15.2.4 Financial Overview
15.2.5 SWOT Analysis
15.2.6 Key Developments
15.3 Giant Manufacturing Co Ltd
15.3.1 Key Facts
15.3.2 Business Description
15.3.3 Products and Services
15.3.4 Financial Overview
15.3.5 SWOT Analysis
15.3.6 Key Developments
15.4 Merida Industry Co., Ltd.
15.4.1 Key Facts
15.4.2 Business Description
15.4.3 Products and Services
15.4.4 Financial Overview
15.4.5 SWOT Analysis
15.4.6 Key Developments
15.5 Pedego Electric Bikes
15.5.1 Key Facts
15.5.2 Business Description
15.5.3 Products and Services
15.5.4 Financial Overview
15.5.5 SWOT Analysis
15.5.6 Key Developments
15.6 Robert Bosch GmbH
15.6.1 Key Facts
15.6.2 Business Description
15.6.3 Products and Services
15.6.4 Financial Overview
15.6.5 SWOT Analysis
15.6.6 Key Developments
15.7 Specialized Bicycle Components, Inc.
15.7.1 Key Facts
15.7.2 Business Description
15.7.3 Products and Services
15.7.4 Financial Overview
15.7.5 SWOT Analysis
15.7.6 Key Developments
15.8 Shimano Inc
15.8.1 Key Facts
15.8.2 Business Description
15.8.3 Products and Services
15.8.4 Financial Overview
15.8.5 SWOT Analysis
15.8.6 Key Developments
15.9 Trek Bicycle Corp
15.9.1 Key Facts
15.9.2 Business Description
15.9.3 Products and Services
15.9.4 Financial Overview
15.9.5 SWOT Analysis
15.9.6 Key Developments
15.10 Yamaha Motor Co Ltd
15.10.1 Key Facts
15.10.2 Business Description
15.10.3 Products and Services
15.10.4 Financial Overview
15.10.5 SWOT Analysis
15.10.6 Key Developments
16. Appendix
16.1 About The Insight Partners
16.2 Word Index
List of Tables
Table 1. E-Bike Market Segmentation
Table 2. List of Vendors in the Value Chain
Table 3. E-Bike Market Revenue and Forecasts To 2030 (US$ Million)
Table 4. E-Bike Market Revenue and Forecasts To 2030 (US$ Million) – Battery Type
Table 5. E-Bike Market Revenue and Forecasts To 2030 (US$ Million) – Motor Type
Table 6. E-Bike Market Revenue and Forecasts To 2030 (US$ Million) – Class
Table 7. E-Bike Market Revenue and Forecasts To 2030 (US$ Million) – Mode
Table 8. North America E-Bike Market Revenue and Forecasts To 2030 (US$ Mn) – By Battery Type
Table 9. North America E-Bike Market Revenue and Forecasts To 2030 (US$ Mn) – By Motor Type
Table 10. North America E-Bike Market Revenue and Forecasts To 2030 (US$ Mn) – By Class
Table 11. North America E-Bike Market Revenue and Forecasts To 2030 (US$ Mn) – By Mode
Table 12. North America E-Bike Market Revenue and Forecasts To 2030 (US$ Mn) – By Country
Table 13. US E-Bike Market Revenue and Forecasts To 2030 (US$ Mn) – By Battery Type
Table 14. US E-Bike Market Revenue and Forecasts To 2030 (US$ Mn) – By Motor Type
Table 15. US E-Bike Market Revenue and Forecasts To 2030 (US$ Mn) – By Class
Table 16. US E-Bike Market Revenue and Forecasts To 2030 (US$ Mn) – By Mode
Table 17. Canada E-Bike Market Revenue and Forecasts To 2030 (US$ Mn) – By Battery Type
Table 18. Canada E-Bike Market Revenue and Forecasts To 2030 (US$ Mn) – By Motor Type
Table 19. Canada E-Bike Market Revenue and Forecasts To 2030 (US$ Mn) – By Class
Table 20. Canada E-Bike Market Revenue and Forecasts To 2030 (US$ Mn) – By Mode
Table 21. Mexico E-Bike Market Revenue and Forecasts To 2030 (US$ Mn) – By Battery Type
Table 22. Mexico E-Bike Market Revenue and Forecasts To 2030 (US$ Mn) – By Motor Type
Table 23. Mexico E-Bike Market Revenue and Forecasts To 2030 (US$ Mn) – By Class
Table 24. Mexico E-Bike Market Revenue and Forecasts To 2030 (US$ Mn) – By Mode
Table 25. Europe E-Bike Market Revenue and Forecasts To 2030 (US$ Mn) – By Battery Type
Table 26. Europe E-Bike Market Revenue and Forecasts To 2030 (US$ Mn) – By Motor Type
Table 27. Europe E-Bike Market Revenue and Forecasts To 2030 (US$ Mn) – By Class
Table 28. Europe E-Bike Market Revenue and Forecasts To 2030 (US$ Mn) – By Mode
Table 29. Europe E-Bike Market Revenue and Forecasts To 2030 (US$ Mn) – By Country
Table 30. Germany E-Bike Market Revenue and Forecasts To 2030 (US$ Mn) – By Battery Type
Table 31. Germany E-Bike Market Revenue and Forecasts To 2030 (US$ Mn) – By Motor Type
Table 32. Germany E-Bike Market Revenue and Forecasts To 2030 (US$ Mn) – By Class
Table 33. Germany E-Bike Market Revenue and Forecasts To 2030 (US$ Mn) – By Mode
Table 34. France E-Bike Market Revenue and Forecasts To 2030 (US$ Mn) – By Battery Type
Table 35. France E-Bike Market Revenue and Forecasts To 2030 (US$ Mn) – By Motor Type
Table 36. France E-Bike Market Revenue and Forecasts To 2030 (US$ Mn) – By Class
Table 37. France E-Bike Market Revenue and Forecasts To 2030 (US$ Mn) – By Mode
Table 38. Italy E-Bike Market Revenue and Forecasts To 2030 (US$ Mn) – By Battery Type
Table 39. Italy E-Bike Market Revenue and Forecasts To 2030 (US$ Mn) – By Motor Type
Table 40. Italy E-Bike Market Revenue and Forecasts To 2030 (US$ Mn) – By Class
Table 41. Italy E-Bike Market Revenue and Forecasts To 2030 (US$ Mn) – By Mode
Table 42. UK E-Bike Market Revenue and Forecasts To 2030 (US$ Mn) – By Battery Type
Table 43. UK E-Bike Market Revenue and Forecasts To 2030 (US$ Mn) – By Motor Type
Table 44. UK E-Bike Market Revenue and Forecasts To 2030 (US$ Mn) – By Class
Table 45. UK E-Bike Market Revenue and Forecasts To 2030 (US$ Mn) – By Mode
Table 46. Netherland E-Bike Market Revenue and Forecasts To 2030 (US$ Mn) – By Battery Type
Table 47. Netherland E-Bike Market Revenue and Forecasts To 2030 (US$ Mn) – By Motor Type
Table 48. Netherland E-Bike Market Revenue and Forecasts To 2030 (US$ Mn) – By Class
Table 49. Netherland E-Bike Market Revenue and Forecasts To 2030 (US$ Mn) – By Mode
Table 50. Rest of Europe E-Bike Market Revenue and Forecasts To 2030 (US$ Mn) – By Battery Type
Table 51. Rest of Europe E-Bike Market Revenue and Forecasts To 2030 (US$ Mn) – By Motor Type
Table 52. Rest of Europe E-Bike Market Revenue and Forecasts To 2030 (US$ Mn) – By Class
Table 53. Rest of Europe E-Bike Market Revenue and Forecasts To 2030 (US$ Mn) – By Mode
Table 54. Asia Pacific E-Bike Market Revenue and Forecasts To 2030 (US$ Mn) – By Battery Type
Table 55. Asia Pacific E-Bike Market Revenue and Forecasts To 2030 (US$ Mn) – By Motor Type
Table 56. Asia Pacific E-Bike Market Revenue and Forecasts To 2030 (US$ Mn) – By Class
Table 57. Asia Pacific E-Bike Market Revenue and Forecasts To 2030 (US$ Mn) – By Mode
Table 58. Asia Pacific E-Bike Market Revenue and Forecasts To 2030 (US$ Mn) – By Country
Table 59. Australia E-Bike Market Revenue and Forecasts To 2030 (US$ Mn) – By Battery Type
Table 60. Australia E-Bike Market Revenue and Forecasts To 2030 (US$ Mn) – By Motor Type
Table 61. Australia E-Bike Market Revenue and Forecasts To 2030 (US$ Mn) – By Class
Table 62. Australia E-Bike Market Revenue and Forecasts To 2030 (US$ Mn) – By Mode
Table 63. China E-Bike Market Revenue and Forecasts To 2030 (US$ Mn) – By Battery Type
Table 64. China E-Bike Market Revenue and Forecasts To 2030 (US$ Mn) – By Motor Type
Table 65. China E-Bike Market Revenue and Forecasts To 2030 (US$ Mn) – By Class
Table 66. China E-Bike Market Revenue and Forecasts To 2030 (US$ Mn) – By Mode
Table 67. India E-Bike Market Revenue and Forecasts To 2030 (US$ Mn) – By Battery Type
Table 68. India E-Bike Market Revenue and Forecasts To 2030 (US$ Mn) – By Motor Type
Table 69. India E-Bike Market Revenue and Forecasts To 2030 (US$ Mn) – By Class
Table 70. India E-Bike Market Revenue and Forecasts To 2030 (US$ Mn) – By Mode
Table 71. Japan E-Bike Market Revenue and Forecasts To 2030 (US$ Mn) – By Battery Type
Table 72. Japan E-Bike Market Revenue and Forecasts To 2030 (US$ Mn) – By Motor Type
Table 73. Japan E-Bike Market Revenue and Forecasts To 2030 (US$ Mn) – By Class
Table 74. Japan E-Bike Market Revenue and Forecasts To 2030 (US$ Mn) – By Mode
Table 75. South Korea E-Bike Market Revenue and Forecasts To 2030 (US$ Mn) – By Battery Type
Table 76. South Korea E-Bike Market Revenue and Forecasts To 2030 (US$ Mn) – By Motor Type
Table 77. South Korea E-Bike Market Revenue and Forecasts To 2030 (US$ Mn) – By Class
Table 78. South Korea E-Bike Market Revenue and Forecasts To 2030 (US$ Mn) – By Mode
Table 79. Rest of Asia Pacific E-Bike Market Revenue and Forecasts To 2030 (US$ Mn) – By Battery Type
Table 80. Rest of Asia Pacific E-Bike Market Revenue and Forecasts To 2030 (US$ Mn) – By Motor Type
Table 81. Rest of Asia Pacific E-Bike Market Revenue and Forecasts To 2030 (US$ Mn) – By Class
Table 82. Rest of Asia Pacific E-Bike Market Revenue and Forecasts To 2030 (US$ Mn) – By Mode
Table 83. Middle East & Africa E-Bike Market Revenue and Forecasts To 2030 (US$ Mn) – By Battery Type
Table 84. Middle East & Africa E-Bike Market Revenue and Forecasts To 2030 (US$ Mn) – By Motor Type
Table 85. Middle East & Africa E-Bike Market Revenue and Forecasts To 2030 (US$ Mn) – By Class
Table 86. Middle East & Africa E-Bike Market Revenue and Forecasts To 2030 (US$ Mn) – By Mode
Table 87. Middle East & Africa E-Bike Market Revenue and Forecasts To 2030 (US$ Mn) – By Country
Table 88. UAE E-Bike Market Revenue and Forecasts To 2030 (US$ Mn) – By Battery Type
Table 89. UAE E-Bike Market Revenue and Forecasts To 2030 (US$ Mn) – By Motor Type
Table 90. UAE E-Bike Market Revenue and Forecasts To 2030 (US$ Mn) – By Class
Table 91. UAE E-Bike Market Revenue and Forecasts To 2030 (US$ Mn) – By Mode
Table 92. Saudi Arabia E-Bike Market Revenue and Forecasts To 2030 (US$ Mn) – By Battery Type
Table 93. Saudi Arabia E-Bike Market Revenue and Forecasts To 2030 (US$ Mn) – By Motor Type
Table 94. Saudi Arabia E-Bike Market Revenue and Forecasts To 2030 (US$ Mn) – By Class
Table 95. Saudi Arabia E-Bike Market Revenue and Forecasts To 2030 (US$ Mn) – By Mode
Table 96. South Africa E-Bike Market Revenue and Forecasts To 2030 (US$ Mn) – By Battery Type
Table 97. South Africa E-Bike Market Revenue and Forecasts To 2030 (US$ Mn) – By Motor Type
Table 98. South Africa E-Bike Market Revenue and Forecasts To 2030 (US$ Mn) – By Class
Table 99. South Africa E-Bike Market Revenue and Forecasts To 2030 (US$ Mn) – By Mode
Table 100. Rest of MEA E-Bike Market Revenue and Forecasts To 2030 (US$ Mn) – By Battery Type
Table 101. Rest of MEA E-Bike Market Revenue and Forecasts To 2030 (US$ Mn) – By Motor Type
Table 102. Rest of MEA E-Bike Market Revenue and Forecasts To 2030 (US$ Mn) – By Class
Table 103. Rest of MEA E-Bike Market Revenue and Forecasts To 2030 (US$ Mn) – By Mode
Table 104. South America E-Bike Market Revenue and Forecasts To 2030 (US$ Mn) – By Battery Type
Table 105. South America E-Bike Market Revenue and Forecasts To 2030 (US$ Mn) – By Motor Type
Table 106. South America E-Bike Market Revenue and Forecasts To 2030 (US$ Mn) – By Class
Table 107. South America E-Bike Market Revenue and Forecasts To 2030 (US$ Mn) – By Mode
Table 108. South America E-Bike Market Revenue and Forecasts To 2030 (US$ Mn) – By Country
Table 109. Brazil E-Bike Market Revenue and Forecasts To 2030 (US$ Mn) – By Battery Type
Table 110. Brazil E-Bike Market Revenue and Forecasts To 2030 (US$ Mn) – By Motor Type
Table 111. Brazil E-Bike Market Revenue and Forecasts To 2030 (US$ Mn) – By Class
Table 112. Brazil E-Bike Market Revenue and Forecasts To 2030 (US$ Mn) – By Mode
Table 113. Argentina E-Bike Market Revenue and Forecasts To 2030 (US$ Mn) – By Battery Type
Table 114. Argentina E-Bike Market Revenue and Forecasts To 2030 (US$ Mn) – By Motor Type
Table 115. Argentina E-Bike Market Revenue and Forecasts To 2030 (US$ Mn) – By Class
Table 116. Argentina E-Bike Market Revenue and Forecasts To 2030 (US$ Mn) – By Mode
Table 117. Rest of SAM E-Bike Market Revenue and Forecasts To 2030 (US$ Mn) – By Battery Type
Table 118. Rest of SAM E-Bike Market Revenue and Forecasts To 2030 (US$ Mn) – By Motor Type
Table 119. Rest of SAM E-Bike Market Revenue and Forecasts To 2030 (US$ Mn) – By Class
Table 120. Rest of SAM E-Bike Market Revenue and Forecasts To 2030 (US$ Mn) – By Mode
Table 121. Heat Map Analysis by Key Players
Table 122. List of Abbreviation
List of Figures
Figure 1. E-Bike Market Segmentation, By Geography
Figure 2. PEST Analysis
Figure 3. Ecosystem: E-Bike Market
Figure 4. Impact Analysis of Drivers and Restraints
Figure 5. E-Bike Market Breakdown by Geography, 2022 and 2030 (%)
Figure 6. E-Bike Market Revenue (US$ Million), 2022 – 2030
Figure 7. E-Bike Market Share (%) – Battery Type, 2022 and 2030
Figure 8. Lithium-Ion Market Revenue and Forecasts To 2030 (US$ Million)
Figure 9. Lithium-Ion Polymer Market Revenue and Forecasts To 2030 (US$ Million)
Figure 10. Lithium-Ion Polymer Market Revenue and Forecasts To 2030 (US$ Million)
Figure 11. Nickel Market Revenue and Forecasts To 2030 (US$ Million)
Figure 12. E-Bike Market Share (%) – Motor Type, 2022 and 2030
Figure 13. Mid Motor Market Revenue and Forecasts To 2030 (US$ Million)
Figure 14. Hub Motor Market Revenue and Forecasts To 2030 (US$ Million)
Figure 15. E-Bike Market Share (%) – Class, 2022 and 2030
Figure 16. Class I Market Revenue and Forecasts To 2030 (US$ Million)
Figure 17. Class II Market Revenue and Forecasts To 2030 (US$ Million)
Figure 18. Class III Market Revenue and Forecasts To 2030 (US$ Million)
Figure 19. E-Bike Market Share (%) – Mode, 2022 and 2030
Figure 20. Pedal Assisted Mode Market Revenue and Forecasts To 2030 (US$ Million)
Figure 21. Throttle Mode Market Revenue and Forecasts To 2030 (US$ Million)
Figure 22. E-Bike Market Breakdown by Region, 2022 and 2030 (%)
Figure 23. North America E-Bike Market Revenue and Forecasts To 2030 (US$ Mn)
Figure 24. North America E-Bike Market Breakdown by Technology (2022 and 2030)
Figure 25. North America E-Bike Market Breakdown by Motor Type (2022 and 2030)
Figure 26. North America E-Bike Market Breakdown by Class (2022 and 2030)
Figure 27. North America E-Bike Market Breakdown by Mode (2022 and 2030)
Figure 28. North America E-Bike Market Breakdown by Key Countries, 2022 and 2030 (%)
Figure 29. US E-Bike Market Revenue and Forecasts To 2030 (US$ Mn)
Figure 30. Canada E-Bike Market Revenue and Forecasts To 2030 (US$ Mn)
Figure 31. Mexico E-Bike Market Revenue and Forecasts To 2030 (US$ Mn)
Figure 32. Europe E-Bike Market Revenue and Forecasts To 2030 (US$ Mn)
Figure 33. Europe E-Bike Market Breakdown by Battery Type (2022 and 2030)
Figure 34. Europe E-Bike Market Breakdown by Motor Type (2022 and 2030)
Figure 35. Europe E-Bike Market Breakdown by Class (2022 and 2030)
Figure 36. Europe E-Bike Market Breakdown by Mode (2022 and 2030)
Figure 37. Europe E-Bike Market Breakdown by Key Countries, 2022 and 2030 (%)
Figure 38. Germany E-Bike Market Revenue and Forecasts To 2030 (US$ Mn)
Figure 39. France E-Bike Market Revenue and Forecasts To 2030 (US$ Mn)
Figure 40. Italy E-Bike Market Revenue and Forecasts To 2030 (US$ Mn)
Figure 41. UK E-Bike Market Revenue and Forecasts To 2030 (US$ Mn)
Figure 42. Netherland E-Bike Market Revenue and Forecasts To 2030 (US$ Mn)
Figure 43. Rest of Europe E-Bike Market Revenue and Forecasts To 2030 (US$ Mn)
Figure 44. Asia Pacific E-Bike Market Revenue and Forecasts To 2030 (US$ Mn)
Figure 45. Asia Pacific E-Bike Market Breakdown by Batter Type (2022 and 2030)
Figure 46. Asia Pacific E-Bike Market Breakdown by Motor Type (2022 and 2030)
Figure 47. Asia Pacific E-Bike Market Breakdown by Class (2022 and 2030)
Figure 48. Asia Pacific E-Bike Market Breakdown by Mode (2022 and 2030)
Figure 49. Asia Pacific E-Bike Market Breakdown by Key Countries, 2022 and 2030 (%)
Figure 50. Australia E-Bike Market Revenue and Forecasts To 2030 (US$ Mn)
Figure 51. China E-Bike Market Revenue and Forecasts To 2030 (US$ Mn)
Figure 52. India E-Bike Market Revenue and Forecasts To 2030 (US$ Mn)
Figure 53. Japan E-Bike Market Revenue and Forecasts To 2030 (US$ Mn)
Figure 54. South Korea E-Bike Market Revenue and Forecasts To 2030 (US$ Mn)
Figure 55. Rest of Asia Pacific E-Bike Market Revenue and Forecasts To 2030 (US$ Mn)
Figure 56. Middle East & Africa E-Bike Market Revenue and Forecasts To 2030 (US$ Mn)
Figure 57. Middle East & Africa E-Bike Market Breakdown by Battery Type (2022 and 2030)
Figure 58. Middle East & Africa E-Bike Market Breakdown by Motor Type (2022 and 2030)
Figure 59. Middle East & Africa E-Bike Market Breakdown by Class (2022 and 2030)
Figure 60. Middle East & Africa E-Bike Market Breakdown by Mode (2022 and 2030)
Figure 61. Middle East & Africa E-Bike Market Breakdown by Key Countries, 2022 and 2030 (%)
Figure 62. UAE E-Bike Market Revenue and Forecasts To 2030 (US$ Mn)
Figure 63. Saudi Arabia E-Bike Market Revenue and Forecasts To 2030 (US$ Mn)
Figure 64. South Africa E-Bike Market Revenue and Forecasts To 2030 (US$ Mn)
Figure 65. Rest of MEA E-Bike Market Revenue and Forecasts To 2030 (US$ Mn)
Figure 66. South America E-Bike Market Revenue and Forecasts To 2030 (US$ Mn)
Figure 67. South America E-Bike Market Breakdown by Battery Type (2022 and 2030)
Figure 68. South America E-Bike Market Breakdown by Motor Type (2022 and 2030)
Figure 69. South America E-Bike Market Breakdown by Class (2022 and 2030)
Figure 70. South America E-Bike Market Breakdown by Mode (2022 and 2030)
Figure 71. South America E-Bike Market Breakdown by Key Countries, 2022 and 2030 (%)
Figure 72. Brazil E-Bike Market Revenue and Forecasts To 2030 (US$ Mn)
Figure 73. Argentina E-Bike Market Revenue and Forecasts To 2030 (US$ Mn)
Figure 74. Rest of SAM E-Bike Market Revenue and Forecasts To 2030 (US$ Mn)
Figure 75. Company Positioning & Concentration
The List of Companies - E-Bike Market
- Haibike
- Aventon Bikes
- Giant Manufacturing Co Ltd
- Merida Industry Co., Ltd.
- Pedego Electric Bikes
- Robert Bosch GmbH
- Specialized Bicycle Components, Inc.
- Shimano Inc.
- Trek Bicycle Corp
- Yamaha Motor Co Ltd
The Insight Partners performs research in 4 major stages: Data Collection & Secondary Research, Primary Research, Data Analysis and Data Triangulation & Final Review.
- Data Collection and Secondary Research:
As a market research and consulting firm operating from a decade, we have published many reports and advised several clients across the globe. First step for any study will start with an assessment of currently available data and insights from existing reports. Further, historical and current market information is collected from Investor Presentations, Annual Reports, SEC Filings, etc., and other information related to company’s performance and market positioning are gathered from Paid Databases (Factiva, Hoovers, and Reuters) and various other publications available in public domain.
Several associations trade associates, technical forums, institutes, societies and organizations are accessed to gain technical as well as market related insights through their publications such as research papers, blogs and press releases related to the studies are referred to get cues about the market. Further, white papers, journals, magazines, and other news articles published in the last 3 years are scrutinized and analyzed to understand the current market trends.
- Primary Research:
The primarily interview analysis comprise of data obtained from industry participants interview and answers to survey questions gathered by in-house primary team.
For primary research, interviews are conducted with industry experts/CEOs/Marketing Managers/Sales Managers/VPs/Subject Matter Experts from both demand and supply side to get a 360-degree view of the market. The primary team conducts several interviews based on the complexity of the markets to understand the various market trends and dynamics which makes research more credible and precise.
A typical research interview fulfils the following functions:
- Provides first-hand information on the market size, market trends, growth trends, competitive landscape, and outlook
- Validates and strengthens in-house secondary research findings
- Develops the analysis team’s expertise and market understanding
Primary research involves email interactions and telephone interviews for each market, category, segment, and sub-segment across geographies. The participants who typically take part in such a process include, but are not limited to:
- Industry participants: VPs, business development managers, market intelligence managers and national sales managers
- Outside experts: Valuation experts, research analysts and key opinion leaders specializing in the electronics and semiconductor industry.
Below is the breakup of our primary respondents by company, designation, and region:

Once we receive the confirmation from primary research sources or primary respondents, we finalize the base year market estimation and forecast the data as per the macroeconomic and microeconomic factors assessed during data collection.
- Data Analysis:
Once data is validated through both secondary as well as primary respondents, we finalize the market estimations by hypothesis formulation and factor analysis at regional and country level.
- 3.1 Macro-Economic Factor Analysis:
We analyse macroeconomic indicators such the gross domestic product (GDP), increase in the demand for goods and services across industries, technological advancement, regional economic growth, governmental policies, the influence of COVID-19, PEST analysis, and other aspects. This analysis aids in setting benchmarks for various nations/regions and approximating market splits. Additionally, the general trend of the aforementioned components aid in determining the market's development possibilities.
- 3.2 Country Level Data:
Various factors that are especially aligned to the country are taken into account to determine the market size for a certain area and country, including the presence of vendors, such as headquarters and offices, the country's GDP, demand patterns, and industry growth. To comprehend the market dynamics for the nation, a number of growth variables, inhibitors, application areas, and current market trends are researched. The aforementioned elements aid in determining the country's overall market's growth potential.
- 3.3 Company Profile:
The “Table of Contents” is formulated by listing and analyzing more than 25 - 30 companies operating in the market ecosystem across geographies. However, we profile only 10 companies as a standard practice in our syndicate reports. These 10 companies comprise leading, emerging, and regional players. Nonetheless, our analysis is not restricted to the 10 listed companies, we also analyze other companies present in the market to develop a holistic view and understand the prevailing trends. The “Company Profiles” section in the report covers key facts, business description, products & services, financial information, SWOT analysis, and key developments. The financial information presented is extracted from the annual reports and official documents of the publicly listed companies. Upon collecting the information for the sections of respective companies, we verify them via various primary sources and then compile the data in respective company profiles. The company level information helps us in deriving the base number as well as in forecasting the market size.
- 3.4 Developing Base Number:
Aggregation of sales statistics (2020-2022) and macro-economic factor, and other secondary and primary research insights are utilized to arrive at base number and related market shares for 2022. The data gaps are identified in this step and relevant market data is analyzed, collected from paid primary interviews or databases. On finalizing the base year market size, forecasts are developed on the basis of macro-economic, industry and market growth factors and company level analysis.
- Data Triangulation and Final Review:
The market findings and base year market size calculations are validated from supply as well as demand side. Demand side validations are based on macro-economic factor analysis and benchmarks for respective regions and countries. In case of supply side validations, revenues of major companies are estimated (in case not available) based on industry benchmark, approximate number of employees, product portfolio, and primary interviews revenues are gathered. Further revenue from target product/service segment is assessed to avoid overshooting of market statistics. In case of heavy deviations between supply and demand side values, all thes steps are repeated to achieve synchronization.
We follow an iterative model, wherein we share our research findings with Subject Matter Experts (SME’s) and Key Opinion Leaders (KOLs) until consensus view of the market is not formulated – this model negates any drastic deviation in the opinions of experts. Only validated and universally acceptable research findings are quoted in our reports.
We have important check points that we use to validate our research findings – which we call – data triangulation, where we validate the information, we generate from secondary sources with primary interviews and then we re-validate with our internal data bases and Subject matter experts. This comprehensive model enables us to deliver high quality, reliable data in shortest possible time.
Trends and growth analysis reports related to E-Bike Market

Oct 2023
Connected Vehicle Market
Size and Forecasts (2020 - 2030), Global and Regional Share, Trends, and Growth Opportunity Analysis By Technology (5G, 4G/LTE, 3G & 2G), Connectivity (Integrated, Tethered, Embedded), Application (Telematics, Infotainment, Driving assistance, Others) and Geography
Oct 2023
Hydrogen Fuel Cell Train Market
Size and Forecasts (2020 - 2030), Global and Regional Share, Trends, and Growth Opportunity Analysis Report Coverage: By Technology (Proton Exchange Membrane Fuel Cell, Phosphoric Acid Fuel Cell, and Others), Component (Hydrogen Fuel Cell Pack, Batteries, Electric Traction Motors, and Others), Rail Type (Passenger Rail, Commuter Rail, Light Rail, Trams, Freight, and Others) and Geography
Oct 2023
Automotive High Voltage Cable Market
Forecast to 2030 - Global Analysis by Vehicle Type [Battery Electric Vehicles (BEV), Plugin Hybrid Electric Vehicles (PHEV), and Plugin Hybrid Vehicles (PHV)], Conductor Type (Copper and Aluminum), and Core Type (Multi Core and Single Core)
Oct 2023
40-Ft Electric Boat Market
Forecast to 2030 - Global Analysis by Propulsion (Pure Electric, Hybrid, and Sail Electric), Battery Type (Nickel-Based, Lead-Acid, and Lithium-Ion), Application (Fishing, Recreational, and Others), Voltage Architecture (12 V, 24 V, and 48 V), and Boat Type (Trawlers, Catamarans, Yachts, Power Cruisers, and Others)