$4450
$3560
The set top box market size is expected to reach US$ 31.08 billion by 2031 from US$ 25.33 billion in 2024. The market is anticipated to register a CAGR of 3.1% during 2025–2031. Integration with the smart home ecosystem is likely to bring new trends to the market in the coming years.
Set Top Box Market Analysis
Contemporary set-top boxes incorporate advanced technologies such as High-Efficiency Video Coding (HEVC), allowing for efficient compression of 4K content and smoother streaming with lower bandwidth usage. Features such as HDR10+ and Dolby Vision have become standard, delivering enhanced visuals by dynamically adjusting brightness and contrast for each frame, resulting in more realistic image quality. Moreover, AI-powered upscaling leverages machine learning to enhance lower-resolution content in real time, improving sharpness and detail to resemble native 4K resolution.
The increasing adoption of smart TVs, rising demand for high-definition (HD) and ultra-high-definition (UHD) content, and expansion of over-the-top (OTT) streaming services are driving the growth of the set top box market. Moreover, innovation in set-top box (STB) technology is creating lucrative opportunities for the growth of the set top box market.
Set Top Box Market Overview
A set-top box is a hardware-based device integrated with software, primarily designed to receive television and related content via terrestrial, cable, satellite, broadband, or local network connections and to deliver video output through at least one dedicated video interface. Set-top boxes offer enhanced picture quality and expanded channel access, as well as features such as pause, record, and playback capabilities. They are especially valuable in regions with weak signal reception or limited access to traditional cable or satellite services. A set-top box provides access to a wide range of television channels, including high-definition and on-demand content. It supports digital video recording (DVR), parental controls, and interactive program guides. Internet-enabled models also offer compatibility with popular streaming applications. With a user-friendly setup and enhanced audio-visual performance, set-top boxes significantly elevate the home entertainment experience.
Customize Research To Suit Your Requirement
We can optimize and tailor the analysis and scope which is unmet through our standard offerings. This flexibility will help you gain the exact information needed for your business planning and decision making.
Set Top Box Market: Strategic Insights
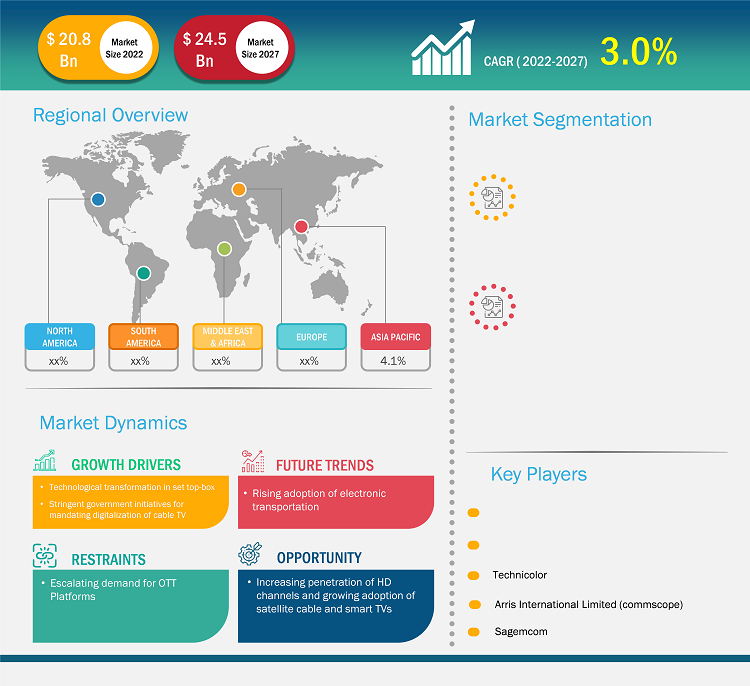
Market Size Value in US$ 20,855.1 Million in 2022 Market Size Value by US$ 25,535.9 Million by 2028 Growth rate CAGR of 3.4% from 2022 to 2028 Forecast Period 2022-2028 Base Year 2022

Naveen
Have a question?
Naveen will walk you through a 15-minute call to present the report’s content and answer all queries if you have any.
 Speak to Analyst
Customize Research To Suit Your Requirement
We can optimize and tailor the analysis and scope which is unmet through our standard offerings. This flexibility will help you gain the exact information needed for your business planning and decision making.
Set Top Box Market: Strategic Insights
| Market Size Value in | US$ 20,855.1 Million in 2022 |
| Market Size Value by | US$ 25,535.9 Million by 2028 |
| Growth rate | CAGR of 3.4% from 2022 to 2028 |
| Forecast Period | 2022-2028 |
| Base Year | 2022 |
Naveen
Have a question?
Naveen will walk you through a 15-minute call to present the report’s content and answer all queries if you have any.
Speak to Analyst
Set Top Box Market Drivers and Opportunities
Expansion of Over-the-Top (OTT) Streaming Services
As digital technology and the internet continue to reshape the entertainment landscape, streaming media has become a key driver of content consumption and engagement. Leading this transformation is the Over-The-Top (OTT) set-top box, a device that has revolutionized traditional TV viewing while paving the way for the future of entertainment. OTT set-top boxes enable users to stream content directly over the internet, bypassing conventional distribution channels. These devices provide access to a broad array of OTT streaming services, such as Netflix, Amazon Prime, and Disney+, while integrating features of live TV and radio. These combine the functionalities of traditional cable and satellite TV with the flexibility of streaming platforms. A key advantage of OTT set-top boxes is their extensive variety of content. These devices aggregate a wide array of entertainment options, from streaming services and YouTube videos to traditional TV channels, providing users with access to a diverse range of content in a single platform. Thus, the expansion of OTT streaming services drives market growth.
Innovation in Set Top Box (STB) Technology
Market players are working on innovation in set-top box technology. For example, in September 2024, ZTE Corporation unveiled its next-generation 4K AI flagship set-top box at the 2024 IBC Show. This innovative device combines the functionalities of a traditional set-top box and a soundbar, offering enhanced computing capabilities and intelligent control. It is positioned as the preferred multi-ecosystem solution for the modern living room; the product supports a wide range of applications and delivers an upgraded home entertainment experience, enabling service providers to drive business growth and increase user engagement. In another example, in January 2022, NXTDIGITAL Limited launched an Android set-top box, Nxtconnect, and a live TV stick, Nxtgo, that gives subscribers access to 700 TV channels and 300,000 hours of OTT content with broadband speeds up to 1,000 Mbps. The Android set-top box features 8GB of storage. It enables subscribers to transform their standard TVs into smart TVs, providing access to a wide range of Android applications beyond OTT, including karaoke and games. For current smart TV users, Nxtgo offers access to up to 700 TV channels, enhancing the overall viewing experience. Thus, advancement in set-top box technology creates a lucrative opportunity for the growth of the set top box market.
Set Top Box Market Report Segmentation Analysis
Key segments that contributed to the derivation of the set top box market analysis are product type and content quality.
- Based on product type, the set top box market is segmented into IPTV, satellite, cable, and others. The IPTV segment dominated the market in 2024.
- By content quality, the set top box market is segmented into standard-definition (SD), high-definition, and 4K. The high-definition segment dominated the market in 2024.
Set Top Box Market Share Analysis by Geography
The set top box market is segmented into five major regions: North America, Europe, Asia Pacific, Middle East & Africa (MEA), and South America. Asia Pacific dominated the market in 2024.
Asia Pacific is experiencing a rise in the adoption of set-top boxes, owing to the rising demand for digital TV, IPTV, and OTT services. Increased internet penetration, competitive pricing, and supportive government initiatives have contributed to this growth, positioning set-top boxes as essential devices for accessing a wide range of content across multiple platforms. For example, in January 2023, Under the Broadcast Infrastructure Network Development (BIND) Scheme, the Indian government planned to distribute over 8 lakh (US$ 0.8 million) Doordarshan DTH receiver sets for free in remote, border, and Left Wing Extremism (LWE)-affected areas. With a budget of Rs 25.39 billion (US$ 304.75 million), the initiative aims to enhance the reach of All India Radio (AIR) and Doordarshan, improving infrastructure and expanding FM coverage to over 80%. The project also includes strengthening mobile TV production and FM networks, with a completion target by 2025–2026.
Set Top Box Market Report Scope
Set Top Box Market News and Recent Developments
The set top box market is evaluated by gathering qualitative and quantitative data post primary and secondary research, which includes important corporate publications, association data, and databases. A few of the developments in the set top box market are listed below:
- Skyworth announced that they have partnered with Fetch TV on the design, production, and launch of the new Fetch Mini G5 set-top box. The device is small, measuring just 10cm square x 2.3cm high, but feature-packed. It includes a DVB-T2 tuner for broadcast TV, 4GB RAM, and a powerful Amlogic S905X4 chip, making it a high-performance entertainment aggregation device delivering a seamless user experience.
(Source: Skyworth, Press Release, September 2024)
- CommScope announced that it has joined forces with du to launch the latest advancement in du TV for the United Arab Emirates (UAE) market, introducing the VIP7802 Ultra-HD set-top box. The VIP7802 represents CommScope’s next-generation set-top box, featuring a fast quad-core CPU, a Vulkan 3D-capable GPU, and dual-band Wi-Fi 6. This high-end, set-top box is designed with a compact footprint, offering users a superior viewing experience with support for 4K UltraHD resolution and High Dynamic Range (HDR) formats that enhance colour, contrast, and brightness.
(Source: CommScope, Press Release, January 2024)
Set Top Box Market Report Coverage and Deliverables
The "Set Top Box Market Size and Forecast (2021–2031)" provides a detailed analysis of the market covering the areas mentioned below:
- Set top box market size and forecast at regional and country levels for all the key market segments covered under the scope
- Set top box market trends as well as market dynamics such as drivers, restraints, and key opportunities
- Detailed PEST and SWOT analysis
- Set top box market analysis covering key market trends, regional framework, major players, regulations, and recent market developments
- Industry landscape and competition analysis covering market concentration, heat map analysis, prominent players, and recent developments for the set top box market
- Detailed company profiles

Report Coverage
Revenue forecast, Company Analysis, Industry landscape, Growth factors, and Trends

Segment Covered
Product and Content Quality

Regional Scope
North America, Europe, Asia Pacific, Middle East & Africa, South & Central America

Country Scope
Argentina, Australia, Brazil, Canada, China, France, Germany, India, Italy, Japan, Mexico, Russian Federation, Saudi Arabia, South Africa, South Korea, United Arab Emirates, United Kingdom, United States
Frequently Asked Questions
The set top box market was valued at US$ 25.33 billion in 2024 and is projected to reach US$ 31.08 billion by 2031; it is expected to grow at a CAGR of 3.1% during 2025–2031.
Increasing adoption of smart TVs, rising demand for high-definition (HD) and ultra-high-definition (UHD) content, expansion of over-the-top (OTT) Streaming Services are the driving factors impacting the set top box market.
Integration with smart home ecosystem is the future trends of the set top box market.
Asia Pacific is anticipated to grow with the highest CAGR over the forecast period 2025-2031.
The Asia Pacific held the largest market share in 2024, followed by Europe.
The key players, holding majority shares, in set top box market includes Apple Inc., Vantiva, EchoStar Corporation, CommScope Holding Co Inc, and SagemCom UK Ltd.
1. Introduction
1.1 Report Guidance
1.2 Market Segmentation
2. Executive Summary
2.1 Analyst Market Outlook
2.2 Market Attractiveness
3. Research Methodology
3.1 Secondary Research
3.2 Primary Research
3.2.1 Hypothesis formulation:
3.2.2 Macro-economic factor analysis:
3.2.3 Developing base number:
3.2.4 Data Triangulation:
3.2.5 Country level data:
3.3 Assumptions and Limitations
4. Set Top Box Market Landscape
4.1 Overview
4.2 PEST Analysis
4.3 Ecosystem Analysis
4.3.1 Component Provider:
4.3.2 Set Top Box Manufacturers:
4.3.3 Distributors/Service Providers:
4.3.4 End Users:
4.3.5 List of Vendors in the Value Chain
5. Set Top Box Market – Key Market Dynamics
5.1 Set Top Box Market – Key Market Dynamics
5.2 Market Drivers
5.2.1 Increasing Adoption of Smart TVs
5.2.2 Rising Demand for High-Definition (HD) and Ultra-High-Definition (UHD) Content
5.2.3 Expansion of Over-the-Top (OTT) Streaming Services.
5.3 Market Restraints
5.3.1 Rising Adoption of Alternatives
5.4 Market Opportunities
5.4.1 Innovation in Set Top Box (STB) Technology
5.5 Future Trends
5.5.1 Integration with Smart Home Ecosystem
5.6 Impact of Drivers and Restraints:
6. Set Top Box Market – Global Market Analysis
6.1 Set Top Box Market Revenue (US$ Million), 2021–2031
6.2 Set Top Box Market Forecast Analysis
7. Set Top Box Market Analysis – by Product Type
7.1 IPTV
7.1.1 Overview
7.1.2 IPTV: Set Top Box Market – Revenue and Forecast to 2031 (US$ Million)
7.2 Satellite
7.2.1 Overview
7.2.2 Satellite: Set Top Box Market – Revenue and Forecast to 2031 (US$ Million)
7.3 Cable
7.3.1 Overview
7.3.2 Cable: Set Top Box Market – Revenue and Forecast to 2031 (US$ Million)
7.4 Others
7.4.1 Overview
7.4.2 Others: Set Top Box Market – Revenue and Forecast to 2031 (US$ Million)
8. Set Top Box Market Analysis – by Content Quality
8.1 Standard Definition (SD)
8.1.1 Overview
8.1.2 Standard Definition (SD): Set Top Box Market – Revenue and Forecast to 2031 (US$ Million)
8.2 High-Definition (HD)
8.2.1 Overview
8.2.2 High-Definition (HD): Set Top Box Market – Revenue and Forecast to 2031 (US$ Million)
8.3 4K
8.3.1 Overview
8.3.2 4K: Set Top Box Market – Revenue and Forecast to 2031 (US$ Million)
9. Set Top Box Market – Geographical Analysis
9.1 Overview
9.2 North America
9.2.1 North America Set Top Box Market Overview
9.2.2 North America: Set Top Box Market – Revenue, 2021–2031 (US$ Million)
9.2.3 North America: Set Top Box Market Breakdown, by Product Type
9.2.3.1 North America: Set Top Box Market – Revenue and Forecast Analysis – by Product Type
9.2.4 North America: Set Top Box Market Breakdown, by Content Quality
9.2.4.1 North America: Set Top Box Market – Revenue and Forecast Analysis – by Content Quality
9.2.5 North America: Set Top Box Market – Revenue and Forecast Analysis – by Country
9.2.5.1 North America: Set Top Box Market – Revenue and Forecast Analysis – by Country
9.2.5.2 United States: Set Top Box Market – Revenue and Forecast, 2021–2031 (US$ Million)
9.2.5.2.1 United States: Set Top Box Market Breakdown, by Product Type
9.2.5.2.2 United States: Set Top Box Market Breakdown, by Content Quality
9.2.5.3 Canada: Set Top Box Market – Revenue and Forecast, 2021–2031 (US$ Million)
9.2.5.3.1 Canada: Set Top Box Market Breakdown, by Product Type
9.2.5.3.2 Canada: Set Top Box Market Breakdown, by Content Quality
9.2.5.4 Mexico: Set Top Box Market – Revenue and Forecast, 2021–2031 (US$ Million)
9.2.5.4.1 Mexico: Set Top Box Market Breakdown, by Product Type
9.2.5.4.2 Mexico: Set Top Box Market Breakdown, by Content Quality
9.3 Europe
9.3.1 Europe Set Top Box Market Overview
9.3.2 Europe: Set Top Box Market – Revenue, 2021–2031 (US$ Million)
9.3.3 Europe: Set Top Box Market Breakdown, by Product Type
9.3.3.1 Europe: Set Top Box Market – Revenue and Forecast Analysis – by Product Type
9.3.4 Europe: Set Top Box Market Breakdown, by Content Quality
9.3.4.1 Europe: Set Top Box Market – Revenue and Forecast Analysis – by Content Quality
9.3.5 Europe: Set Top Box Market – Revenue and Forecast Analysis – by Country
9.3.5.1 Europe: Set Top Box Market – Revenue and Forecast Analysis – by Country
9.3.5.2 Germany: Set Top Box Market – Revenue and Forecast, 2021–2031 (US$ Million)
9.3.5.2.1 Germany: Set Top Box Market Breakdown, by Product Type
9.3.5.2.2 Germany: Set Top Box Market Breakdown, by Content Quality
9.3.5.3 France: Set Top Box Market – Revenue and Forecast, 2021–2031 (US$ Million)
9.3.5.3.1 France: Set Top Box Market Breakdown, by Product Type
9.3.5.3.2 France: Set Top Box Market Breakdown, by Content Quality
9.3.5.4 United Kingdom: Set Top Box Market – Revenue and Forecast, 2021–2031 (US$ Million)
9.3.5.4.1 United Kingdom: Set Top Box Market Breakdown, by Product Type
9.3.5.4.2 United Kingdom: Set Top Box Market Breakdown, by Content Quality
9.3.5.5 Italy: Set Top Box Market – Revenue and Forecast, 2021–2031 (US$ Million)
9.3.5.5.1 Italy: Set Top Box Market Breakdown, by Product Type
9.3.5.5.2 Italy: Set Top Box Market Breakdown, by Content Quality
9.3.5.6 Russia: Set Top Box Market – Revenue and Forecast, 2021–2031 (US$ Million)
9.3.5.6.1 Russia: Set Top Box Market Breakdown, by Product Type
9.3.5.6.2 Russia: Set Top Box Market Breakdown, by Content Quality
9.3.5.7 Rest of Europe: Set Top Box Market – Revenue and Forecast, 2021–2031 (US$ Million)
9.3.5.7.1 Rest of Europe: Set Top Box Market Breakdown, by Product Type
9.3.5.7.2 Rest of Europe: Set Top Box Market Breakdown, by Content Quality
9.4 Asia Pacific
9.4.1 Asia Pacific Set Top Box Market Overview
9.4.2 Asia Pacific: Set Top Box Market – Revenue, 2021–2031 (US$ Million)
9.4.3 Asia Pacific: Set Top Box Market Breakdown, by Product Type
9.4.3.1 Asia Pacific: Set Top Box Market – Revenue and Forecast Analysis – by Product Type
9.4.4 Asia Pacific: Set Top Box Market Breakdown, by Content Quality
9.4.4.1 Asia Pacific: Set Top Box Market – Revenue and Forecast Analysis – by Content Quality
9.4.5 Asia Pacific: Set Top Box Market – Revenue and Forecast Analysis – by Country
9.4.5.1 Asia Pacific: Set Top Box Market – Revenue and Forecast Analysis – by Country
9.4.5.2 China: Set Top Box Market – Revenue and Forecast, 2021–2031 (US$ Million)
9.4.5.2.1 China: Set Top Box Market Breakdown, by Product Type
9.4.5.2.2 China: Set Top Box Market Breakdown, by Content Quality
9.4.5.3 Japan: Set Top Box Market – Revenue and Forecast, 2021–2031 (US$ Million)
9.4.5.3.1 Japan: Set Top Box Market Breakdown, by Product Type
9.4.5.3.2 Japan: Set Top Box Market Breakdown, by Content Quality
9.4.5.4 India: Set Top Box Market – Revenue and Forecast, 2021–2031 (US$ Million)
9.4.5.4.1 India: Set Top Box Market Breakdown, by Product Type
9.4.5.4.2 India: Set Top Box Market Breakdown, by Content Quality
9.4.5.5 South Korea: Set Top Box Market – Revenue and Forecast, 2021–2031 (US$ Million)
9.4.5.5.1 South Korea: Set Top Box Market Breakdown, by Product Type
9.4.5.5.2 South Korea: Set Top Box Market Breakdown, by Content Quality
9.4.5.6 Australia: Set Top Box Market – Revenue and Forecast, 2021–2031 (US$ Million)
9.4.5.6.1 Australia: Set Top Box Market Breakdown, by Product Type
9.4.5.6.2 Australia: Set Top Box Market Breakdown, by Content Quality
9.4.5.7 Rest of APAC: Set Top Box Market – Revenue and Forecast, 2021–2031 (US$ Million)
9.4.5.7.1 Rest of APAC: Set Top Box Market Breakdown, by Product Type
9.4.5.7.2 Rest of APAC: Set Top Box Market Breakdown, by Content Quality
9.5 Middle East and Africa
9.5.1 Middle East and Africa Set Top Box Market Overview
9.5.2 Middle East and Africa: Set Top Box Market – Revenue, 2021–2031 (US$ Million)
9.5.3 Middle East and Africa: Set Top Box Market Breakdown, by Product Type
9.5.3.1 Middle East and Africa: Set Top Box Market – Revenue and Forecast Analysis – by Product Type
9.5.4 Middle East and Africa: Set Top Box Market Breakdown, by Content Quality
9.5.4.1 Middle East and Africa: Set Top Box Market – Revenue and Forecast Analysis – by Content Quality
9.5.5 Middle East and Africa: Set Top Box Market – Revenue and Forecast Analysis – by Country
9.5.5.1 Middle East and Africa: Set Top Box Market – Revenue and Forecast Analysis – by Country
9.5.5.2 Saudi Arabia: Set Top Box Market – Revenue and Forecast, 2021–2031 (US$ Million)
9.5.5.2.1 Saudi Arabia: Set Top Box Market Breakdown, by Product Type
9.5.5.2.2 Saudi Arabia: Set Top Box Market Breakdown, by Content Quality
9.5.5.3 United Arab Emirates: Set Top Box Market – Revenue and Forecast, 2021–2031 (US$ Million)
9.5.5.3.1 United Arab Emirates: Set Top Box Market Breakdown, by Product Type
9.5.5.3.2 United Arab Emirates: Set Top Box Market Breakdown, by Content Quality
9.5.5.4 South Africa: Set Top Box Market – Revenue and Forecast, 2021–2031 (US$ Million)
9.5.5.4.1 South Africa: Set Top Box Market Breakdown, by Product Type
9.5.5.4.2 South Africa: Set Top Box Market Breakdown, by Content Quality
9.5.5.5 Rest of Middle East and Africa: Set Top Box Market – Revenue and Forecast, 2021–2031 (US$ Million)
9.5.5.5.1 Rest of Middle East and Africa: Set Top Box Market Breakdown, by Product Type
9.5.5.5.2 Rest of Middle East and Africa: Set Top Box Market Breakdown, by Content Quality
9.6 South and Central America
9.6.1 South and Central America Set Top Box Market Overview
9.6.2 South and Central America: Set Top Box Market – Revenue, 2021–2031 (US$ Million)
9.6.3 South and Central America: Set Top Box Market Breakdown, by Product Type
9.6.3.1 South and Central America: Set Top Box Market – Revenue and Forecast Analysis – by Product Type
9.6.4 South and Central America: Set Top Box Market Breakdown, by Content Quality
9.6.4.1 South and Central America: Set Top Box Market – Revenue and Forecast Analysis – by Content Quality
9.6.5 South and Central America: Set Top Box Market – Revenue and Forecast Analysis – by Country
9.6.5.1 South and Central America: Set Top Box Market – Revenue and Forecast Analysis – by Country
9.6.5.2 Brazil: Set Top Box Market – Revenue and Forecast, 2021–2031 (US$ Million)
9.6.5.2.1 Brazil: Set Top Box Market Breakdown, by Product Type
9.6.5.2.2 Brazil: Set Top Box Market Breakdown, by Content Quality
9.6.5.3 Argentina: Set Top Box Market – Revenue and Forecast, 2021–2031 (US$ Million)
9.6.5.3.1 Argentina: Set Top Box Market Breakdown, by Product Type
9.6.5.3.2 Argentina: Set Top Box Market Breakdown, by Content Quality
9.6.5.4 Rest of South and Central America: Set Top Box Market – Revenue and Forecast, 2021–2031 (US$ Million)
9.6.5.4.1 Rest of South and Central America: Set Top Box Market Breakdown, by Product Type
9.6.5.4.2 Rest of South and Central America: Set Top Box Market Breakdown, by Content Quality
10. Competitive Landscape
10.1 Company Positioning & Concentration
10.2 Heat Map Analysis By Key Players
11. Industry Landscape
11.1 Overview
11.2 Market Initiative
11.3 Merger and Acquisition
12. Company Profiles
12.1 Advanced Digital Broadcast SA
12.1.1 Key Facts
12.1.2 Business Description
12.1.3 Financial Overview
12.1.4 SWOT Analysis
12.2 CommScope Holding Co Inc
12.2.1 Key Facts
12.2.2 Business Description
12.2.3 Products and Services
12.2.4 Financial Overview
12.2.5 SWOT Analysis
12.2.6 Key Developments
12.3 Huawei Technologies Co Ltd
12.3.1 Key Facts
12.3.2 Business Description
12.3.3 Products and Services
12.3.4 Financial Overview
12.3.5 SWOT Analysis
12.4 Humax Co Ltd
12.4.1 Key Facts
12.4.2 Business Description
12.4.3 Products and Services
12.4.4 Financial Overview
12.4.5 SWOT Analysis
12.5 Kaonmedia Co Ltd
12.5.1 Key Facts
12.5.2 Business Description
12.5.3 Products and Services
12.5.4 Financial Overview
12.5.5 SWOT Analysis
12.6 Sagemcom UK Ltd
12.6.1 Key Facts
12.6.2 Business Description
12.6.3 Financial Overview
12.6.4 SWOT Analysis
12.7 Shenzhen Skyworth Digital Technology Co Ltd
12.7.1 Key Facts
12.7.2 Business Description
12.7.3 Products and Services
12.7.4 Financial Overview
12.7.5 SWOT Analysis
12.7.6 Key Developments
12.8 Vantiva SA
12.8.1 Key Facts
12.8.2 Business Description
12.8.3 Products and Services
12.8.4 Financial Overview
12.8.5 SWOT Analysis
12.8.6 Key Developments
12.9 Shenzhen Coship Electronics Co Ltd
12.9.1 Key Facts
12.9.2 Business Description
12.9.3 Products and Services
12.9.4 Financial Overview
12.9.5 SWOT Analysis
12.10 Apple Inc
12.10.1 Key Facts
12.10.2 Business Description
12.10.3 Products and Services
12.10.4 Financial Overview
12.10.5 SWOT Analysis
12.11 Nuvyyo Inc
12.11.1 Key Facts
12.11.2 Business Description
12.11.3 Financial Overview
12.12 SiliconDust USA Inc
12.12.1 Key Facts
12.12.2 Business Description
12.12.3 Financial Overview
12.13 Zapperbox Inc
12.13.1 Key Facts
12.13.2 Business Description
12.13.3 Financial Overview
12.14 Zinwell Corp
12.14.1 Key Facts
12.14.2 Business Description
12.14.3 Financial Overview
12.15 Geniatech Inc
12.15.1 Key Facts
12.15.2 Business Description
12.15.3 Financial Overview
12.16 Atlanta DTH Inc
12.16.1 Key Facts
12.16.2 Business Description
12.16.3 Financial Overview
12.17 Echostar Corp
12.17.1 Key Facts
12.17.2 Business Description
12.17.3 Products and Services
12.17.4 Financial Overview
12.17.5 SWOT Analysis
12.17.6 Key Developments
13. Appendix
13.1 About The Insight Partners
List of Tables
Table 1. Set Top Box Market Segmentation
Table 2. List of Vendors
Table 3. Set Top Box Market – Revenue, 2021–2024 (US$ Million)
Table 4. Set Top Box Market – Revenue Forecast, 2025–2031 (US$ Million)
Table 5. Set Top Box Market – Revenue, 2021–2024 (US$ Million) – by Product Type
Table 6. Set Top Box Market – Revenue Forecast, 2025–2031 (US$ Million) – by Product Type
Table 7. Set Top Box Market – Revenue, 2021–2024 (US$ Million) – by Content Quality
Table 8. Set Top Box Market – Revenue Forecast, 2025–2031 (US$ Million) – by Content Quality
Table 9. North America: Set Top Box Market – Revenue, 2021–2024 (US$ Million) – by Product Type
Table 10. North America: Set Top Box Market – Revenue Forecast, 2025–2031 (US$ Million) – by Product Type
Table 11. North America: Set Top Box Market – Revenue, 2021–2024 (US$ Million) – by Content Quality
Table 12. North America: Set Top Box Market – Revenue Forecast, 2025–2031 (US$ Million) – by Content Quality
Table 13. North America: Set Top Box Market – Revenue, 2021–2024 (US$ Million) – by Country
Table 14. North America: Set Top Box Market – Revenue Forecast, 2025–2031 (US$ Million) – by Country
Table 15. United States: Set Top Box Market – Revenue, 2021–2024 (US$ Million) – by Product Type
Table 16. United States: Set Top Box Market – Revenue Forecast, 2025–2031 (US$ Million) – by Product Type
Table 17. United States: Set Top Box Market – Revenue, 2021–2024 (US$ Million) – by Content Quality
Table 18. United States: Set Top Box Market – Revenue Forecast, 2025–2031 (US$ Million) – by Content Quality
Table 19. Canada: Set Top Box Market – Revenue, 2021–2024 (US$ Million) – by Product Type
Table 20. Canada: Set Top Box Market – Revenue Forecast, 2025–2031 (US$ Million) – by Product Type
Table 21. Canada: Set Top Box Market – Revenue, 2021–2024 (US$ Million) – by Content Quality
Table 22. Canada: Set Top Box Market – Revenue Forecast, 2025–2031 (US$ Million) – by Content Quality
Table 23. Mexico: Set Top Box Market – Revenue, 2021–2024 (US$ Million) – by Product Type
Table 24. Mexico: Set Top Box Market – Revenue Forecast, 2025–2031 (US$ Million) – by Product Type
Table 25. Mexico: Set Top Box Market – Revenue, 2021–2024 (US$ Million) – by Content Quality
Table 26. Mexico: Set Top Box Market – Revenue Forecast, 2025–2031 (US$ Million) – by Content Quality
Table 27. Europe: Set Top Box Market – Revenue, 2021–2024 (US$ Million) – by Product Type
Table 28. Europe: Set Top Box Market – Revenue Forecast, 2025–2031 (US$ Million) – by Product Type
Table 29. Europe: Set Top Box Market – Revenue, 2021–2024 (US$ Million) – by Content Quality
Table 30. Europe: Set Top Box Market – Revenue Forecast, 2025–2031 (US$ Million) – by Content Quality
Table 31. Europe: Set Top Box Market – Revenue, 2021–2024 (US$ Million) – by Country
Table 32. Europe: Set Top Box Market – Revenue Forecast, 2025–2031 (US$ Million) – by Country
Table 33. Germany: Set Top Box Market – Revenue, 2021–2024 (US$ Million) – by Product Type
Table 34. Germany: Set Top Box Market – Revenue Forecast, 2025–2031 (US$ Million) – by Product Type
Table 35. Germany: Set Top Box Market – Revenue, 2021–2024 (US$ Million) – by Content Quality
Table 36. Germany: Set Top Box Market – Revenue Forecast, 2025–2031 (US$ Million) – by Content Quality
Table 37. France: Set Top Box Market – Revenue, 2021–2024 (US$ Million) – by Product Type
Table 38. France: Set Top Box Market – Revenue Forecast, 2025–2031 (US$ Million) – by Product Type
Table 39. France: Set Top Box Market – Revenue, 2021–2024 (US$ Million) – by Content Quality
Table 40. France: Set Top Box Market – Revenue Forecast, 2025–2031 (US$ Million) – by Content Quality
Table 41. United Kingdom: Set Top Box Market – Revenue, 2021–2024 (US$ Million) – by Product Type
Table 42. United Kingdom: Set Top Box Market – Revenue Forecast, 2025–2031 (US$ Million) – by Product Type
Table 43. United Kingdom: Set Top Box Market – Revenue, 2021–2024 (US$ Million) – by Content Quality
Table 44. United Kingdom: Set Top Box Market – Revenue Forecast, 2025–2031 (US$ Million) – by Content Quality
Table 45. Italy: Set Top Box Market – Revenue, 2021–2024 (US$ Million) – by Product Type
Table 46. Italy: Set Top Box Market – Revenue Forecast, 2025–2031 (US$ Million) – by Product Type
Table 47. Italy: Set Top Box Market – Revenue, 2021–2024 (US$ Million) – by Content Quality
Table 48. Italy: Set Top Box Market – Revenue Forecast, 2025–2031 (US$ Million) – by Content Quality
Table 49. Russia: Set Top Box Market – Revenue, 2021–2024 (US$ Million) – by Product Type
Table 50. Russia: Set Top Box Market – Revenue Forecast, 2025–2031 (US$ Million) – by Product Type
Table 51. Russia: Set Top Box Market – Revenue, 2021–2024 (US$ Million) – by Content Quality
Table 52. Russia: Set Top Box Market – Revenue Forecast, 2025–2031 (US$ Million) – by Content Quality
Table 53. Rest of Europe: Set Top Box Market – Revenue, 2021–2024 (US$ Million) – by Product Type
Table 54. Rest of Europe: Set Top Box Market – Revenue Forecast, 2025–2031 (US$ Million) – by Product Type
Table 55. Rest of Europe: Set Top Box Market – Revenue, 2021–2024 (US$ Million) – by Content Quality
Table 56. Rest of Europe: Set Top Box Market – Revenue Forecast, 2025–2031 (US$ Million) – by Content Quality
Table 57. Asia Pacific: Set Top Box Market – Revenue, 2021–2024 (US$ Million) – by Product Type
Table 58. Asia Pacific: Set Top Box Market – Revenue Forecast, 2025–2031 (US$ Million) – by Product Type
Table 59. Asia Pacific: Set Top Box Market – Revenue, 2021–2024 (US$ Million) – by Content Quality
Table 60. Asia Pacific: Set Top Box Market – Revenue Forecast, 2025–2031 (US$ Million) – by Content Quality
Table 61. Asia Pacific: Set Top Box Market – Revenue, 2021–2024 (US$ Million) – by Country
Table 62. Asia Pacific: Set Top Box Market – Revenue Forecast, 2025–2031 (US$ Million) – by Country
Table 63. China: Set Top Box Market – Revenue, 2021–2024 (US$ Million) – by Product Type
Table 64. China: Set Top Box Market – Revenue Forecast, 2025–2031 (US$ Million) – by Product Type
Table 65. China: Set Top Box Market – Revenue, 2021–2024 (US$ Million) – by Content Quality
Table 66. China: Set Top Box Market – Revenue Forecast, 2025–2031 (US$ Million) – by Content Quality
Table 67. Japan: Set Top Box Market – Revenue, 2021–2024 (US$ Million) – by Product Type
Table 68. Japan: Set Top Box Market – Revenue Forecast, 2025–2031 (US$ Million) – by Product Type
Table 69. Japan: Set Top Box Market – Revenue, 2021–2024 (US$ Million) – by Content Quality
Table 70. Japan: Set Top Box Market – Revenue Forecast, 2025–2031 (US$ Million) – by Content Quality
Table 71. India: Set Top Box Market – Revenue, 2021–2024 (US$ Million) – by Product Type
Table 72. India: Set Top Box Market – Revenue Forecast, 2025–2031 (US$ Million) – by Product Type
Table 73. India: Set Top Box Market – Revenue, 2021–2024 (US$ Million) – by Content Quality
Table 74. India: Set Top Box Market – Revenue Forecast, 2025–2031 (US$ Million) – by Content Quality
Table 75. South Korea: Set Top Box Market – Revenue, 2021–2024 (US$ Million) – by Product Type
Table 76. South Korea: Set Top Box Market – Revenue Forecast, 2025–2031 (US$ Million) – by Product Type
Table 77. South Korea: Set Top Box Market – Revenue, 2021–2024 (US$ Million) – by Content Quality
Table 78. South Korea: Set Top Box Market – Revenue Forecast, 2025–2031 (US$ Million) – by Content Quality
Table 79. Australia: Set Top Box Market – Revenue, 2021–2024 (US$ Million) – by Product Type
Table 80. Australia: Set Top Box Market – Revenue Forecast, 2025–2031 (US$ Million) – by Product Type
Table 81. Australia: Set Top Box Market – Revenue, 2021–2024 (US$ Million) – by Content Quality
Table 82. Australia: Set Top Box Market – Revenue Forecast, 2025–2031 (US$ Million) – by Content Quality
Table 83. Rest of APAC: Set Top Box Market – Revenue, 2021–2024 (US$ Million) – by Product Type
Table 84. Rest of APAC: Set Top Box Market – Revenue Forecast, 2025–2031 (US$ Million) – by Product Type
Table 85. Rest of APAC: Set Top Box Market – Revenue, 2021–2024 (US$ Million) – by Content Quality
Table 86. Rest of APAC: Set Top Box Market – Revenue Forecast, 2025–2031 (US$ Million) – by Content Quality
Table 87. Middle East and Africa: Set Top Box Market – Revenue, 2021–2024 (US$ Million) – by Product Type
Table 88. Middle East and Africa: Set Top Box Market – Revenue Forecast, 2025–2031 (US$ Million) – by Product Type
Table 89. Middle East and Africa: Set Top Box Market – Revenue, 2021–2024 (US$ Million) – by Content Quality
Table 90. Middle East and Africa: Set Top Box Market – Revenue Forecast, 2025–2031 (US$ Million) – by Content Quality
Table 91. Middle East and Africa: Set Top Box Market – Revenue, 2021–2024 (US$ Million) – by Country
Table 92. Middle East and Africa: Set Top Box Market – Revenue Forecast, 2025–2031 (US$ Million) – by Country
Table 93. Saudi Arabia: Set Top Box Market – Revenue, 2021–2024 (US$ Million) – by Product Type
Table 94. Saudi Arabia: Set Top Box Market – Revenue Forecast, 2025–2031 (US$ Million) – by Product Type
Table 95. Saudi Arabia: Set Top Box Market – Revenue, 2021–2024 (US$ Million) – by Content Quality
Table 96. Saudi Arabia: Set Top Box Market – Revenue Forecast, 2025–2031 (US$ Million) – by Content Quality
Table 97. United Arab Emirates: Set Top Box Market – Revenue, 2021–2024 (US$ Million) – by Product Type
Table 98. United Arab Emirates: Set Top Box Market – Revenue Forecast, 2025–2031 (US$ Million) – by Product Type
Table 99. United Arab Emirates: Set Top Box Market – Revenue, 2021–2024 (US$ Million) – by Content Quality
Table 100. United Arab Emirates: Set Top Box Market – Revenue Forecast, 2025–2031 (US$ Million) – by Content Quality
Table 101. South Africa: Set Top Box Market – Revenue, 2021–2024 (US$ Million) – by Product Type
Table 102. South Africa: Set Top Box Market – Revenue Forecast, 2025–2031 (US$ Million) – by Product Type
Table 103. South Africa: Set Top Box Market – Revenue, 2021–2024 (US$ Million) – by Content Quality
Table 104. South Africa: Set Top Box Market – Revenue Forecast, 2025–2031 (US$ Million) – by Content Quality
Table 105. Rest of Middle East and Africa: Set Top Box Market – Revenue, 2021–2024 (US$ Million) – by Product Type
Table 106. Rest of Middle East and Africa: Set Top Box Market – Revenue Forecast, 2025–2031 (US$ Million) – by Product Type
Table 107. Rest of Middle East and Africa: Set Top Box Market – Revenue, 2021–2024 (US$ Million) – by Content Quality
Table 108. Rest of Middle East and Africa: Set Top Box Market – Revenue Forecast, 2025–2031 (US$ Million) – by Content Quality
Table 109. South and Central America: Set Top Box Market – Revenue, 2021–2024 (US$ Million) – by Product Type
Table 110. South and Central America: Set Top Box Market – Revenue Forecast, 2025–2031 (US$ Million) – by Product Type
Table 111. South and Central America: Set Top Box Market – Revenue, 2021–2024 (US$ Million) – by Content Quality
Table 112. South and Central America: Set Top Box Market – Revenue Forecast, 2025–2031 (US$ Million) – by Content Quality
Table 113. South and Central America: Set Top Box Market – Revenue, 2021–2024 (US$ Million) – by Country
Table 114. South and Central America: Set Top Box Market – Revenue Forecast, 2025–2031 (US$ Million) – by Country
Table 115. Brazil: Set Top Box Market – Revenue, 2021–2024 (US$ Million) – by Product Type
Table 116. Brazil: Set Top Box Market – Revenue Forecast, 2025–2031 (US$ Million) – by Product Type
Table 117. Brazil: Set Top Box Market – Revenue, 2021–2024 (US$ Million) – by Content Quality
Table 118. Brazil: Set Top Box Market – Revenue Forecast, 2025–2031 (US$ Million) – by Content Quality
Table 119. Argentina: Set Top Box Market – Revenue, 2021–2024 (US$ Million) – by Product Type
Table 120. Argentina: Set Top Box Market – Revenue Forecast, 2025–2031 (US$ Million) – by Product Type
Table 121. Argentina: Set Top Box Market – Revenue, 2021–2024 (US$ Million) – by Content Quality
Table 122. Argentina: Set Top Box Market – Revenue Forecast, 2025–2031 (US$ Million) – by Content Quality
Table 123. Rest of South and Central America: Set Top Box Market – Revenue, 2021–2024 (US$ Million) – by Product Type
Table 124. Rest of South and Central America: Set Top Box Market – Revenue Forecast, 2025–2031 (US$ Million) – by Product Type
Table 125. Rest of South and Central America: Set Top Box Market – Revenue, 2021–2024 (US$ Million) – by Content Quality
Table 126. Rest of South and Central America: Set Top Box Market – Revenue Forecast, 2025–2031 (US$ Million) – by Content Quality
Table 127. Company Positioning & Concentration
List of Figures
Figure 1. Set Top Box Market Segmentation, by Geography
Figure 2. PEST Analysis
Figure 3. Ecosystem Analysis
Figure 4. Impact Analysis of Drivers and Restraints
Figure 5. Set Top Box Market Revenue (US$ Million), 2021–2031
Figure 6. Set Top Box Market Share (%) – by Product Type (2024 and 2031)
Figure 7. IPTV: Set Top Box Market – Revenue and Forecast to 2031 (US$ Million)
Figure 8. Satellite: Set Top Box Market – Revenue and Forecast to 2031 (US$ Million)
Figure 9. Cable: Set Top Box Market – Revenue and Forecast to 2031 (US$ Million)
Figure 10. Others: Set Top Box Market – Revenue and Forecast to 2031 (US$ Million)
Figure 11. Set Top Box Market Share (%) – by Content Quality (2024 and 2031)
Figure 12. Standard Definition (SD): Set Top Box Market – Revenue and Forecast to 2031 (US$ Million)
Figure 13. High-Definition (HD): Set Top Box Market – Revenue and Forecast to 2031 (US$ Million)
Figure 14. 4K: Set Top Box Market – Revenue and Forecast to 2031 (US$ Million)
Figure 15. Set Top Box Market Breakdown by Region, 2024 and 2031 (%)
Figure 16. North America: Set Top Box Market – Revenue, 2021–2031 (US$ Million)
Figure 17. North America: Set Top Box Market Breakdown, by Product Type (2024 and 2031)
Figure 18. North America: Set Top Box Market Breakdown, by Content Quality (2024 and 2031)
Figure 19. North America: Set Top Box Market Breakdown, by Key Countries, 2024 and 2031 (%)
Figure 20. United States: Set Top Box Market – Revenue and Forecast, 2021–2031 (US$ Million)
Figure 21. Canada: Set Top Box Market – Revenue and Forecast, 2021–2031 (US$ Million)
Figure 22. Mexico: Set Top Box Market – Revenue and Forecast, 2021–2031 (US$ Million)
Figure 23. Europe: Set Top Box Market – Revenue, 2021–2031 (US$ Million)
Figure 24. Europe: Set Top Box Market Breakdown, by Product Type (2024 and 2031)
Figure 25. Europe: Set Top Box Market Breakdown, by Content Quality (2024 and 2031)
Figure 26. Europe: Set Top Box Market Breakdown, by Key Countries, 2024 and 2031 (%)
Figure 27. Germany: Set Top Box Market – Revenue and Forecast, 2021–2031 (US$ Million)
Figure 28. France: Set Top Box Market – Revenue and Forecast, 2021–2031 (US$ Million)
Figure 29. United Kingdom: Set Top Box Market – Revenue and Forecast, 2021–2031 (US$ Million)
Figure 30. Italy: Set Top Box Market – Revenue and Forecast, 2021–2031 (US$ Million)
Figure 31. Russia: Set Top Box Market – Revenue and Forecast, 2021–2031 (US$ Million)
Figure 32. Rest of Europe: Set Top Box Market – Revenue and Forecast, 2021–2031 (US$ Million)
Figure 33. Asia Pacific: Set Top Box Market – Revenue, 2021–2031 (US$ Million)
Figure 34. Asia Pacific: Set Top Box Market Breakdown, by Product Type (2024 and 2031)
Figure 35. Asia Pacific: Set Top Box Market Breakdown, by Content Quality (2024 and 2031)
Figure 36. Asia Pacific: Set Top Box Market Breakdown, by Key Countries, 2024 and 2031 (%)
Figure 37. China: Set Top Box Market – Revenue and Forecast, 2021–2031 (US$ Million)
Figure 38. Japan: Set Top Box Market – Revenue and Forecast, 2021–2031 (US$ Million)
Figure 39. India: Set Top Box Market – Revenue and Forecast, 2021–2031 (US$ Million)
Figure 40. South Korea: Set Top Box Market – Revenue and Forecast, 2021–2031 (US$ Million)
Figure 41. Australia: Set Top Box Market – Revenue and Forecast, 2021–2031 (US$ Million)
Figure 42. Rest of APAC: Set Top Box Market – Revenue and Forecast, 2021–2031 (US$ Million)
Figure 43. Middle East and Africa: Set Top Box Market – Revenue, 2021–2031 (US$ Million)
Figure 44. Middle East and Africa: Set Top Box Market Breakdown, by Product Type (2024 and 2031)
Figure 45. Middle East and Africa: Set Top Box Market Breakdown, by Content Quality (2024 and 2031)
Figure 46. Middle East and Africa: Set Top Box Market Breakdown, by Key Countries, 2024 and 2031 (%)
Figure 47. Saudi Arabia: Set Top Box Market – Revenue and Forecast, 2021–2031 (US$ Million)
Figure 48. United Arab Emirates: Set Top Box Market – Revenue and Forecast, 2021–2031 (US$ Million)
Figure 49. South Africa: Set Top Box Market – Revenue and Forecast, 2021–2031 (US$ Million)
Figure 50. Rest of Middle East and Africa: Set Top Box Market – Revenue and Forecast, 2021–2031 (US$ Million)
Figure 51. South and Central America: Set Top Box Market – Revenue, 2021–2031 (US$ Million)
Figure 52. South and Central America: Set Top Box Market Breakdown, by Product Type (2024 and 2031)
Figure 53. South and Central America: Set Top Box Market Breakdown, by Content Quality (2024 and 2031)
Figure 54. South and Central America: Set Top Box Market Breakdown, by Key Countries, 2024 and 2031 (%)
Figure 55. Brazil: Set Top Box Market – Revenue and Forecast, 2021–2031 (US$ Million)
Figure 56. Argentina: Set Top Box Market – Revenue and Forecast, 2021–2031 (US$ Million)
Figure 57. Rest of South and Central America: Set Top Box Market – Revenue and Forecast, 2021–2031 (US$ Million)
Figure 58. Heat Map Analysis By Key Players
The List of Companies - Set Top Box Market
- Advanced Digital Broadcast SA
- CommScope Holding Co Inc
- Huawei Technologies Co Ltd
- Humax Co Ltd
- Kaonmedia Co Ltd
- SagemCom UK Ltd
- Shenzhen Skyworth Digital Technology Co Ltd
- EchoStar Corporation (DISH Network L.L.C.)
- Vantiva
- Shenzhen Coship Electronics Co Ltd
- Apple Inc.
The Insight Partners performs research in 4 major stages: Data Collection & Secondary Research, Primary Research, Data Analysis and Data Triangulation & Final Review.
- Data Collection and Secondary Research:
As a market research and consulting firm operating from a decade, we have published many reports and advised several clients across the globe. First step for any study will start with an assessment of currently available data and insights from existing reports. Further, historical and current market information is collected from Investor Presentations, Annual Reports, SEC Filings, etc., and other information related to company’s performance and market positioning are gathered from Paid Databases (Factiva, Hoovers, and Reuters) and various other publications available in public domain.
Several associations trade associates, technical forums, institutes, societies and organizations are accessed to gain technical as well as market related insights through their publications such as research papers, blogs and press releases related to the studies are referred to get cues about the market. Further, white papers, journals, magazines, and other news articles published in the last 3 years are scrutinized and analyzed to understand the current market trends.
- Primary Research:
The primarily interview analysis comprise of data obtained from industry participants interview and answers to survey questions gathered by in-house primary team.
For primary research, interviews are conducted with industry experts/CEOs/Marketing Managers/Sales Managers/VPs/Subject Matter Experts from both demand and supply side to get a 360-degree view of the market. The primary team conducts several interviews based on the complexity of the markets to understand the various market trends and dynamics which makes research more credible and precise.
A typical research interview fulfils the following functions:
- Provides first-hand information on the market size, market trends, growth trends, competitive landscape, and outlook
- Validates and strengthens in-house secondary research findings
- Develops the analysis team’s expertise and market understanding
Primary research involves email interactions and telephone interviews for each market, category, segment, and sub-segment across geographies. The participants who typically take part in such a process include, but are not limited to:
- Industry participants: VPs, business development managers, market intelligence managers and national sales managers
- Outside experts: Valuation experts, research analysts and key opinion leaders specializing in the electronics and semiconductor industry.
Below is the breakup of our primary respondents by company, designation, and region:

Once we receive the confirmation from primary research sources or primary respondents, we finalize the base year market estimation and forecast the data as per the macroeconomic and microeconomic factors assessed during data collection.
- Data Analysis:
Once data is validated through both secondary as well as primary respondents, we finalize the market estimations by hypothesis formulation and factor analysis at regional and country level.
- 3.1 Macro-Economic Factor Analysis:
We analyse macroeconomic indicators such the gross domestic product (GDP), increase in the demand for goods and services across industries, technological advancement, regional economic growth, governmental policies, the influence of COVID-19, PEST analysis, and other aspects. This analysis aids in setting benchmarks for various nations/regions and approximating market splits. Additionally, the general trend of the aforementioned components aid in determining the market's development possibilities.
- 3.2 Country Level Data:
Various factors that are especially aligned to the country are taken into account to determine the market size for a certain area and country, including the presence of vendors, such as headquarters and offices, the country's GDP, demand patterns, and industry growth. To comprehend the market dynamics for the nation, a number of growth variables, inhibitors, application areas, and current market trends are researched. The aforementioned elements aid in determining the country's overall market's growth potential.
- 3.3 Company Profile:
The “Table of Contents” is formulated by listing and analyzing more than 25 - 30 companies operating in the market ecosystem across geographies. However, we profile only 10 companies as a standard practice in our syndicate reports. These 10 companies comprise leading, emerging, and regional players. Nonetheless, our analysis is not restricted to the 10 listed companies, we also analyze other companies present in the market to develop a holistic view and understand the prevailing trends. The “Company Profiles” section in the report covers key facts, business description, products & services, financial information, SWOT analysis, and key developments. The financial information presented is extracted from the annual reports and official documents of the publicly listed companies. Upon collecting the information for the sections of respective companies, we verify them via various primary sources and then compile the data in respective company profiles. The company level information helps us in deriving the base number as well as in forecasting the market size.
- 3.4 Developing Base Number:
Aggregation of sales statistics (2020-2022) and macro-economic factor, and other secondary and primary research insights are utilized to arrive at base number and related market shares for 2022. The data gaps are identified in this step and relevant market data is analyzed, collected from paid primary interviews or databases. On finalizing the base year market size, forecasts are developed on the basis of macro-economic, industry and market growth factors and company level analysis.
- Data Triangulation and Final Review:
The market findings and base year market size calculations are validated from supply as well as demand side. Demand side validations are based on macro-economic factor analysis and benchmarks for respective regions and countries. In case of supply side validations, revenues of major companies are estimated (in case not available) based on industry benchmark, approximate number of employees, product portfolio, and primary interviews revenues are gathered. Further revenue from target product/service segment is assessed to avoid overshooting of market statistics. In case of heavy deviations between supply and demand side values, all thes steps are repeated to achieve synchronization.
We follow an iterative model, wherein we share our research findings with Subject Matter Experts (SME’s) and Key Opinion Leaders (KOLs) until consensus view of the market is not formulated – this model negates any drastic deviation in the opinions of experts. Only validated and universally acceptable research findings are quoted in our reports.
We have important check points that we use to validate our research findings – which we call – data triangulation, where we validate the information, we generate from secondary sources with primary interviews and then we re-validate with our internal data bases and Subject matter experts. This comprehensive model enables us to deliver high quality, reliable data in shortest possible time.
Trends and growth analysis reports related to Set Top Box Market

Jul 2025
Optical Measuring Machine Market
Size and Forecast (2021 - 2031), Global and Regional Share, Trend, and Growth Opportunity Analysis Report Coverage: By Equipment [Profile Projectors, Optical Digitizers and Scanners (ODSs), Coordinate Measuring Machines (CMMs), Measuring Microscopes, Video Measuring Machines (VMM) or Vision Measuring Systems, Profilometers, and Others], Optical Digitizers And Scanners (ODSS) Type (3D Laser Scanners, Structured Light Scanners and Laser Trackers), Application (Straight (Prismatic) Parts and Turned Parts), Turned Parts Type (Shafts, Bushings, Rings, and Others), Type (Contact and Noncontact), Industry Vertical (Automotive, Aerospace and Defense, Energy and Power, Electronics Manufacturing, Industrial, Medical, and Others), and Geography
Jul 2025
Smart Casing Running Tools Market
Size and Forecast (2021 - 2031), Global and Regional Share, Trend, and Growth Opportunity Analysis Report Coverage: By Hardware [Remote Display, Sensor Kit (Torque and Tension Sensor, Position Sensor, Data Transmission Sensor, and Others), Head Assembly, Gripping Assembly, Circulator Assembly, Power Supply, and Other Accessories], Software (Inbuilt and Optional), Sales [Direct Sales and Aftermarket (Parts and Accessories and Service and Rental)], Application (Onshore and Offshore), Technology (Fully Automated CRT, Remotely Operated CRT, and Hybrid CRT), and Geography
Jul 2025
Spark Detection System Market
Size and Forecast (2021 - 2031), Global and Regional Share, Trend, and Growth Opportunity Analysis Report Coverage: By Component [Infrared Spark Detection Systems and Ultraviolet (UV) Spark Detection Systems], Application (Wood-Based Panel Industry, Textile Industry, Pulp and Paper Industry, Bioenergy, Food Industry, and Others), and Geography (North America, Europe, Asia Pacific, Middle East and Africa, and South and Central America)
Jul 2025
Remote Access Solution Market
Size and Forecast (2021 - 2031), Global and Regional Share, Trend, and Growth Opportunity Analysis Report Coverage: By Type [Secure Remote Access-VPN, Identity and Access Management (IAM) Solutions, Multi-Factor Authentication, Single Sign-On (SSO), Endpoint Security, and Others], Mode of Deployment (Cloud and On-Premise), End-Use Industry (IT and Telecommunications, BFSI, Healthcare, Government, Manufacturing, and Others), and Geography
Jul 2025
Process Instrumentation Market
Size and Forecast (2021 - 2031), Global and Regional Share, Trend, and Growth Opportunity Analysis Report Coverage: By Technology (Flow Meter, Pressure and Temperature Sensor, Analytical Instrument, and Level Meter), Flow Meter (Mass Flow, EMF, Vortex, Ultrasonic, and Others), Level Meter (High Frequency Radar, TDR, and Others), Application (Oil and Gas, Energy and Power, Water and Wastewater, Food and Beverage, Marine, Petrochemical, Chemical, and Others), and Geography (North America, Europe, Asia Pacific, Middle East and Africa, and South and Central America)
Jul 2025
Hall Effect Teslameter Market
Size and Forecast (2021 - 2031), Global and Regional Share, Trend, and Growth Opportunity Analysis Report Coverage: By Type (Analog Hall Effect Teslameters and Digital Hall Effect Teslameters), End Users (Automotive, Industrial, Healthcare, Aerospace, Laboratory, and Others), and Geography
Jul 2025
Automotive Board to Board Connector Market
Size and Forecast (2021 - 2031), Global and Regional Share, Trend, and Growth Opportunity Analysis Report Coverage: By Type (Pin Headers, Sockets, Floating Connector, and Card Edge Connector), Pin Headers (Stacked Headers and Shrouded Headers), Application (Powertrain Control Systems, Infotainment and Navigation Systems, Advanced Driver Assistance Systems (ADAS), Electric Vehicles (EV) and Hybrid Vehicle Systems, Lighting Control Systems, Autonomous Vehicles, and Others), Pitch (Less Than 1 mm, 1–2 mm, and More Than 2 mm), Number of Pin (2–12 Pin, 13–30 Pin, 31–50 Pin, 51–100 Pin, and 100+ Pin), and Geography
Jul 2025
Radiation Hardened Motor Controller and Motor Drive Market
Size and Forecast (2021 - 2031), Global and Regional Share, Trend, and Growth Opportunity Analysis Report Coverage: By Type (Motor Controller and Motor Drive), Motor Drive (AC Drive, DC Drive, and BLDC), Application (Space Exploration, Military and Defense, Nuclear Power Plants, and Others), and Geography