$4450
$3560
The maritime analytics market size was valued at US$ 1.27 billion in 2024 and is expected to reach US$ 2.56 billion by 2031; it is estimated to record a CAGR of 10.6% from 2025 to 2031. Integration of AI and ML with maritime analytics software is likely to remain a key market trend.
Maritime Analytics Market Analysis
One of the key benefits of maritime analytics is its ability to help companies comply with stringent environmental regulations. It can assist in monitoring emissions, optimizing fuel usage, and ensuring compliance with international environmental standards, such as the International Maritime Organization's (IMO) regulations on carbon emissions. Among the primary drivers contributing to the adoption of maritime analytics is the need for operational optimization. It helps companies streamline processes such as fleet management, route optimization, fuel consumption, and maintenance scheduling. By leveraging real-time data, businesses can make data-driven decisions to reduce fuel usage, improve fleet performance, and lower operational costs, contributing to more efficient and profitable operations. The rapid advancements in artificial intelligence (AI), machine learning (ML), the Internet of Things (IoT), and cloud computing fuel the growth of the maritime analytics market. These technologies enable the collection, processing, and analysis of vast amounts of data from ships, ports, and supply chains, offering businesses the tools to improve decision-making, predict trends, and enhance overall operational performance.
Maritime Analytics Market Overview
Maritime analytics refers to the use of advanced data analytics, AI, and ML technologies to optimize and enhance operations within the maritime industry. The process involves collecting, processing, and analyzing vast amounts of data generated by ships, ports, and other maritime assets to improve decision-making, streamline processes, and drive efficiencies. Maritime analytics provides shipping companies, logistics providers, and port authorities with actionable insights that can reduce operational costs, improve safety, and increase overall efficiency. These analytical tools can track vessel performance, monitor fuel consumption, optimize shipping routes, predict maintenance needs, and enhance crew management. By leveraging real-time data, maritime analytics allows companies to proactively address potential issues such as equipment failures, route inefficiencies, or safety risks, thereby reducing downtime and increasing profitability.
Customize Research To Suit Your Requirement
We can optimize and tailor the analysis and scope which is unmet through our standard offerings. This flexibility will help you gain the exact information needed for your business planning and decision making.
Maritime Analytics Market: Strategic Insights
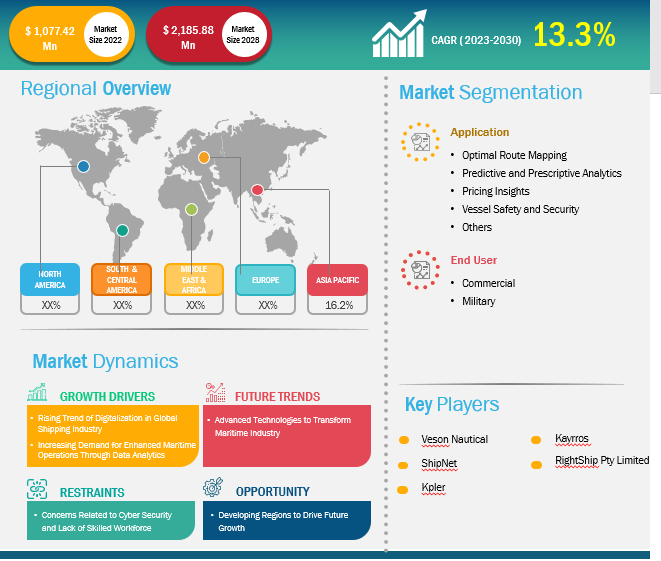
Market Size Value in US$ 1,077.42 million in 2022 Market Size Value by US$ 2,185.88 million by 2028 Growth rate CAGR of 13.3% from 2023 to 2028 Forecast Period 2023-2028 Base Year 2022

Naveen
Have a question?
Naveen will walk you through a 15-minute call to present the report’s content and answer all queries if you have any.
 Speak to Analyst
Customize Research To Suit Your Requirement
We can optimize and tailor the analysis and scope which is unmet through our standard offerings. This flexibility will help you gain the exact information needed for your business planning and decision making.
Maritime Analytics Market: Strategic Insights
| Market Size Value in | US$ 1,077.42 million in 2022 |
| Market Size Value by | US$ 2,185.88 million by 2028 |
| Growth rate | CAGR of 13.3% from 2023 to 2028 |
| Forecast Period | 2023-2028 |
| Base Year | 2022 |
Naveen
Have a question?
Naveen will walk you through a 15-minute call to present the report’s content and answer all queries if you have any.
Speak to Analyst
Maritime Analytics Market Drivers and Opportunities
Increasing Maritime Logistics and Digitization
As global trade continues its upward trajectory, the maritime industry is under increasing pressure to deliver enhanced efficiency, sustainability, and real-time operational transparency. Maritime analytics has emerged as a pivotal enabler in addressing these challenges by offering actionable, data-driven insights that streamline shipping operations, optimize fleet management, and drive significant cost efficiencies. According to the United Nations Conference on Trade and Development (UNCTAD), global maritime trade witnessed a 2.4% growth in 2023, reaching 12.3 billion tons—a notable recovery following the contraction experienced in 2022. Projections indicate that the sector will sustain growth, expanding from an estimated 2% in 2024 to an average annual growth rate of 2.4% through 2029.
To capitalize on this expanding market and strengthen maritime transportation, logistics, and supply chain infrastructure, major industry players are making substantial investments. In a landmark announcement in March 2025, CMA CGM Group—a global leader in maritime, land, air, and logistics services and owner of the US flag carrier American President Lines (APL)—revealed plans to invest US$ 20 billion over the next four years. This strategic capital injection aims to fortify the U.S. maritime economy and facilitate the transformation of America’s domestic supply chain. Building on a 35-year presence in the US, CMA CGM currently operates across 40 states, employing approximately 15,000 personnel nationwide. The Group is a vital partner in U.S. trade, managing the transport of over five million shipping containers annually to and from the country.
Digital transformation is accelerating within the maritime sector, with data analytics and advanced digital technologies reshaping vessel operations, maintenance, and overall supply chain management. These innovations are instrumental in enhancing operational reliability, extending asset lifecycles, and reducing operational expenditures. The adoption of automation, Internet of Things (IoT), and artificial intelligence (AI)-driven platforms is enabling maritime operators to gain unprecedented visibility into fleet performance and logistics workflows, thereby optimizing decision-making processes and elevating service quality. Moreover, digitalization is a critical catalyst for the industry’s sustainability agenda, particularly in advancing decarbonization objectives. The maritime sector is committed to achieving net-zero greenhouse gas emissions in international shipping by 2050. Collaborative initiatives like the March 2025 Letter of Intent (LoI) signed between India and Singapore underscore this commitment, focusing on maritime digitalization and decarbonization efforts. This partnership aims to identify key stakeholders and formalize a framework through a memorandum of understanding to develop the Singapore-India Green and Digital Shipping Corridor (GDSC), which will serve as a model for sustainable and technologically advanced maritime trade routes. The convergence of rising trade volumes, increasing demand for operational efficiency, and a robust push toward environmental sustainability are collectively driving robust growth in the maritime analytics market. Companies are leveraging advanced analytics to optimize route planning, fuel consumption, and predictive maintenance, thereby enhancing profitability while aligning with global regulatory standards. Looking ahead, the maritime analytics market is poised for significant expansion fueled by continuous investments in digital infrastructure, the proliferation of smart shipping technologies, and strategic partnerships aimed at creating greener and more efficient maritime ecosystems. As stakeholders across the value chain prioritize innovation and sustainability, maritime analytics will remain indispensable in shaping the future of global trade logistics.
Regulatory Compliance and Sustainability Initiatives
Regulatory bodies have implemented proactive measures to reduce the environmental footprint ofmaritime transport. For example, the International Maritime Organization (IMO) introduced the Energy Efficiency Existing Ship Index (EEXI) and the Carbon Intensity Indicator (CII) to enforce stricter environmental standards. Effective January 1, 2023, these initiatives aim for a 50% reduction in greenhouse gas (GHG) emissions from ships by 2050, based on 2008 levels. The EEXI and CII set benchmarks to measure carbon dioxide emissions per ton of cargo transported per nautical mile. Additionally, the European Union's 'Fit for 55' program targets a 55% reduction in GHG emissions by 2030 compared to 1990 levels.
As governments and international organizations are implementing stringent emission reduction targets and sustainability regulations, shipping companies are turning to advanced analytics solutions to ensure compliance. These analytics tools enable companies to monitor and manage their environmental impact, track emission levels, optimize fuel usage, and improve fleet sustainability. By adopting these solutions, firms can meet current and future regulations while simultaneously advancing their corporate social responsibility (CSR) objectives. This increasing demand for sustainability and compliance-driven solutions creates a strong market opportunity for providers of maritime analytics technologies as shipping companies focus on enhancing operational efficiency and reducing their environmental footprint.
Maritime Analytics Market Report Segmentation Analysis
Key segments that contributed to the derivation of the maritime analytics market analysis are component, deployment mode, application, and end user.
- Based on component, the market is bifurcated into software and services. The software segment dominated the market in 2024.
- By deployment mode, the market is bifurcated into on-premises and cloud. The cloud segment dominated the market in 2024.
- In terms of application, the market is divided into optimal route mapping, predictive and prescriptive analytics, pricing insights, vessel safety and security, and others. The predictive and prescriptive analytics segment dominated the market in 2024.
- Based on end user, the market is bifurcated into commercial and military. The commercial segment dominated the market in 2024.
Maritime Analytics Market Share Analysis by Geography
The maritime analytics market is segmented into five major regions: North America, Europe, Asia Pacific (APAC), the Middle East & Africa (MEA), and South & Central America. Asia Pacific dominated the market in 2023, followed by Europe and North America.
In the North American region, the US is known for its advanced port infrastructure and robust maritime sector, largely driven by the country's reliance on imported goods industries. Based on the US Maritime Shipping Import-Export Trade Data for 2023, the US has a total trade volume of US$ 5.21 trillion, with a trade deficit of US$ 1.19 trillion. The outsourcing of manufacturing and production to Asian economies has strengthened this dependency. The US maritime industry depends on specialized technical solutions and services to ensure the efficient operation, maintenance, and growth of its infrastructure. The availability of financial support, coupled with the early adoption of advanced technological solutions, has accelerated the uptake of maritime analytics software among US businesses. This shift has resulted in the widespread adoption of modern tools focused on predictive maintenance, route optimization, security, and risk management within the maritime sector, creating opportunities for market players. In November 2024, Kpler, a data and analytics platform for seaborne trade intelligence, signed an agreement to acquire Spire Maritime, a provider of satellite-powered data for real-time global vessel tracking, from Spire Global. The deal, valued at US$ 241 million, includes a US$ 233.5 million purchase price and an additional US$ 7.5 million for services over 12 months following the closure. This acquisition underscores the growing demand for maritime analytics in the region.
Maritime Analytics Market Report Scope
Maritime Analytics Market News and Recent Developments
The maritime analytics market is evaluated by gathering qualitative and quantitative data post primary and secondary research, which includes important corporate publications, association data, and databases. A few of the developments in the maritime analytics market are listed below:
- Maritech Holdings Limited brand Sea migrated all customers from the latest acquisitions of Chinsay and MarDocs onto the Sea contract management solution. In doing so, Sea reached an important milestone in its ambition to create a consolidated platform for managing and concluding recaps and charter parties, benefiting all participants across the global maritime trade ecosystem.(Source: Maritech Holdings Limited, Press Release, June 2025)
- Windward unveiled its groundbreaking Critical Maritime Infrastructure Protection solution. This AI-powered innovation is specifically designed to safeguard crucial global maritime infrastructure, including cables, pipelines, and rigs, from escalating security threats.(Source: Windward, Press Release, February 2025)
Maritime Analytics Market Report Coverage and Deliverables
The "Maritime Analytics Market Size and Forecast (2021–2031)" provides a detailed analysis of the market covering the areas mentioned below:
- Maritime analytics market size and forecast at global, regional, and country levels for all the key market segments covered under the scope
- Maritime analytics market trends, as well as market dynamics such as drivers, restraints, and key opportunities
- Detailed PEST and SWOT analysis
- Maritime analytics market analysis covering key market trends, global and regional framework, major players, regulations, and recent market developments
- Industry landscape and competition analysis covering market concentration, heat map analysis, prominent players, and recent developments in the maritime analytics market
- Detailed company profiles

Report Coverage
Revenue forecast, Company Analysis, Industry landscape, Growth factors, and Trends

Segment Covered
Application, and End User

Regional Scope
North America, Europe, Asia Pacific, Middle East & Africa, South & Central America

Country Scope
Argentina, Australia, Brazil, Canada, China, France, Germany, India, Italy, Japan, Mexico, Russia, Saudi Arabia, South Africa, South Korea, United Arab Emirates, United Kingdom, United States
Frequently Asked Questions
The Asia Pacific held the largest market share in 2024, followed by Europe.
The maritime analytics market was valued at US$ 1.27 billion in 2024 and is projected to reach US$ 2.56 billion by 2031; it is expected to grow at a CAGR of 10.6% during 2025–2031.
The maritime analytics market is expected to reach US$ 2.56 billion in the year 2031.
The key players, holding majority shares, in maritime analytics market includes Wärtsilä, Inmarsat Global Limited, ABB, ZeroNorth A/S, and Hexagon AB.
Increasing maritime logistics and digitization, rising need for maritime vessel management, and growth in maritime infrastructure and smart ports are the driving factors impacting the maritime analytics market.
Integration of AI and ML with maritime analytics software are the future trends of the maritime analytics market.
1. Introduction
1.1 The Insight Partners Research Report Guidance
1.2 Market Segmentation
2. Executive Summary
2.1 Analyst Market Outlook
2.2 Market Attractiveness
3. Research Methodology
3.1 Secondary Research
3.2 Primary Research
3.2.1 Hypothesis formulation:
3.2.2 Macro-economic factor analysis:
3.2.3 Developing base number:
3.2.4 Data Triangulation:
3.2.5 Country level data:
4. Maritime Analytics Market Landscape
4.1 Overview
4.2 PEST Analysis
4.3 Ecosystem Analysis
4.3.1 Software Providers:
4.3.2 System Integrator:
4.3.3 End Users:
4.3.4 List of Vendors in the Value Chain
5. Maritime Analytics Market – Key Market Dynamics
5.1 Maritime Analytics Market – Key Market Dynamics
5.2 Market Drivers
5.2.1 Increasing Maritime Logistics and Digitization
5.2.2 Rising Need for Maritime Vessel Management
5.2.3 Growth in Maritime Infrastructure and Smart Ports
5.3 Market Restraints
5.3.1 Concerns Related to Cyber Security and Data Breaches
5.4 Market Opportunities
5.4.1 Regulatory Compliance and Sustainability Initiatives
5.5 Future Trends
5.5.1 Integration of AI and ML with Maritime Analytics Software
5.6 Impact of Drivers and Restraints:
6. Maritime Analytics Market – Global Market Analysis
6.1 Maritime Analytics Market Revenue (US$ Million), 2021–2031
6.2 Maritime Analytics Market Forecast Analysis
7. Maritime Analytics Market Analysis – by Component
7.1 Software
7.1.1 Overview
7.1.2 Software: Maritime Analytics Market – Revenue and Forecast to 2031 (US$ Million)
7.2 Services
7.2.1 Overview
7.2.2 Services: Maritime Analytics Market – Revenue and Forecast to 2031 (US$ Million)
8. Maritime Analytics Market Analysis – by Deployment
8.1 Cloud
8.1.1 Overview
8.1.2 Cloud: Maritime Analytics Market – Revenue and Forecast to 2031 (US$ Million)
8.2 On Premises
8.2.1 Overview
8.2.2 On Premises: Maritime Analytics Market – Revenue and Forecast to 2031 (US$ Million)
9. Maritime Analytics Market Analysis – by Application
9.1 Predictive and Prescriptive Analytics
9.1.1 Overview
9.1.2 Predictive and Prescriptive Analytics: Maritime Analytics Market – Revenue and Forecast to 2031 (US$ Million)
9.2 Optimal Route Mapping
9.2.1 Overview
9.2.2 Optimal Route Mapping: Maritime Analytics Market – Revenue and Forecast to 2031 (US$ Million)
9.3 Pricing Insights
9.3.1 Overview
9.3.2 Pricing Insights: Maritime Analytics Market – Revenue and Forecast to 2031 (US$ Million)
9.4 Vessel Safety and Security
9.4.1 Overview
9.4.2 Vessel Safety and Security: Maritime Analytics Market – Revenue and Forecast to 2031 (US$ Million)
9.5 Others
9.5.1 Overview
9.5.2 Others: Maritime Analytics Market – Revenue and Forecast to 2031 (US$ Million)
10. Maritime Analytics Market Analysis – by End User
10.1 Commercial
10.1.1 Overview
10.1.2 Commercial: Maritime Analytics Market – Revenue and Forecast to 2031 (US$ Million)
10.2 Military
10.2.1 Overview
10.2.2 Military: Maritime Analytics Market – Revenue and Forecast to 2031 (US$ Million)
11. Maritime Analytics Market – Geographical Analysis
11.1 Overview
11.2 North America
11.2.1 North America Maritime Analytics Market Overview
11.2.2 North America: Maritime Analytics Market – Revenue, 2021 - 2031 (US$ Million)
11.2.3 North America: Maritime Analytics Market Breakdown, by Component
11.2.3.1 North America: Maritime Analytics Market– Revenue and Forecast Analysis – by Component
11.2.4 North America: Maritime Analytics Market Breakdown, by Deployment
11.2.4.1 North America: Maritime Analytics Market– Revenue and Forecast Analysis – by Deployment
11.2.5 North America: Maritime Analytics Market Breakdown, by Application
11.2.5.1 North America: Maritime Analytics Market– Revenue and Forecast Analysis – by Application
11.2.6 North America: Maritime Analytics Market Breakdown, by End User
11.2.6.1 North America: Maritime Analytics Market– Revenue and Forecast Analysis – by End User
11.2.7 North America: Maritime Analytics Market – Revenue and Forecast Analysis – by Country
11.2.7.1 North America: Maritime Analytics Market – Revenue and Forecast Analysis – by Country
11.2.7.2 United States: Maritime Analytics Market – Revenue, 2021 - 2031 (US$ Million)
11.2.7.2.1 United States: Maritime Analytics Market Breakdown, by Component
11.2.7.2.2 United States: Maritime Analytics Market Breakdown, by Deployment
11.2.7.2.3 United States: Maritime Analytics Market Breakdown, by Application
11.2.7.2.4 United States: Maritime Analytics Market Breakdown, by End User
11.2.7.3 Canada: Maritime Analytics Market – Revenue, 2021 - 2031 (US$ Million)
11.2.7.3.1 Canada: Maritime Analytics Market Breakdown, by Component
11.2.7.3.2 Canada: Maritime Analytics Market Breakdown, by Deployment
11.2.7.3.3 Canada: Maritime Analytics Market Breakdown, by Application
11.2.7.3.4 Canada: Maritime Analytics Market Breakdown, by End User
11.2.7.4 Mexico: Maritime Analytics Market – Revenue, 2021 - 2031 (US$ Million)
11.2.7.4.1 Mexico: Maritime Analytics Market Breakdown, by Component
11.2.7.4.2 Mexico: Maritime Analytics Market Breakdown, by Deployment
11.2.7.4.3 Mexico: Maritime Analytics Market Breakdown, by Application
11.2.7.4.4 Mexico: Maritime Analytics Market Breakdown, by End User
11.3 Europe
11.3.1 Europe Maritime Analytics Market Overview
11.3.2 Europe: Maritime Analytics Market – Revenue, 2021 - 2031 (US$ Million)
11.3.3 Europe: Maritime Analytics Market Breakdown, by Component
11.3.3.1 Europe: Maritime Analytics Market– Revenue and Forecast Analysis – by Component
11.3.4 Europe: Maritime Analytics Market Breakdown, by Deployment
11.3.4.1 Europe: Maritime Analytics Market– Revenue and Forecast Analysis – by Deployment
11.3.5 Europe: Maritime Analytics Market Breakdown, by Application
11.3.5.1 Europe: Maritime Analytics Market– Revenue and Forecast Analysis – by Application
11.3.6 Europe: Maritime Analytics Market Breakdown, by End User
11.3.6.1 Europe: Maritime Analytics Market– Revenue and Forecast Analysis – by End User
11.3.7 Europe: Maritime Analytics Market – Revenue and Forecast Analysis – by Country
11.3.7.1 Europe: Maritime Analytics Market – Revenue and Forecast Analysis – by Country
11.3.7.2 United Kingdom: Maritime Analytics Market – Revenue, 2021 - 2031 (US$ Million)
11.3.7.2.1 United Kingdom: Maritime Analytics Market Breakdown, by Component
11.3.7.2.2 United Kingdom: Maritime Analytics Market Breakdown, by Deployment
11.3.7.2.3 United Kingdom: Maritime Analytics Market Breakdown, by Application
11.3.7.2.4 United Kingdom: Maritime Analytics Market Breakdown, by End User
11.3.7.3 Germany: Maritime Analytics Market – Revenue, 2021 - 2031 (US$ Million)
11.3.7.3.1 Germany: Maritime Analytics Market Breakdown, by Component
11.3.7.3.2 Germany: Maritime Analytics Market Breakdown, by Deployment
11.3.7.3.3 Germany: Maritime Analytics Market Breakdown, by Application
11.3.7.3.4 Germany: Maritime Analytics Market Breakdown, by End User
11.3.7.4 France: Maritime Analytics Market – Revenue, 2021 - 2031 (US$ Million)
11.3.7.4.1 France: Maritime Analytics Market Breakdown, by Component
11.3.7.4.2 France: Maritime Analytics Market Breakdown, by Deployment
11.3.7.4.3 France: Maritime Analytics Market Breakdown, by Application
11.3.7.4.4 France: Maritime Analytics Market Breakdown, by End User
11.3.7.5 Italy: Maritime Analytics Market – Revenue, 2021 - 2031 (US$ Million)
11.3.7.5.1 Italy: Maritime Analytics Market Breakdown, by Component
11.3.7.5.2 Italy: Maritime Analytics Market Breakdown, by Deployment
11.3.7.5.3 Italy: Maritime Analytics Market Breakdown, by Application
11.3.7.5.4 Italy: Maritime Analytics Market Breakdown, by End User
11.3.7.6 Russia: Maritime Analytics Market – Revenue, 2021 - 2031 (US$ Million)
11.3.7.6.1 Russia: Maritime Analytics Market Breakdown, by Component
11.3.7.6.2 Russia: Maritime Analytics Market Breakdown, by Deployment
11.3.7.6.3 Russia: Maritime Analytics Market Breakdown, by Application
11.3.7.6.4 Russia: Maritime Analytics Market Breakdown, by End User
11.3.7.7 Rest of Europe: Maritime Analytics Market – Revenue, 2021 - 2031 (US$ Million)
11.3.7.7.1 Rest of Europe: Maritime Analytics Market Breakdown, by Component
11.3.7.7.2 Rest of Europe: Maritime Analytics Market Breakdown, by Deployment
11.3.7.7.3 Rest of Europe: Maritime Analytics Market Breakdown, by Application
11.3.7.7.4 Rest of Europe: Maritime Analytics Market Breakdown, by End User
11.4 Asia Pacific
11.4.1 Asia Pacific Maritime Analytics Market Overview
11.4.2 Asia Pacific: Maritime Analytics Market – Revenue, 2021 - 2031 (US$ Million)
11.4.3 Asia Pacific: Maritime Analytics Market Breakdown, by Component
11.4.3.1 Asia Pacific: Maritime Analytics Market– Revenue and Forecast Analysis – by Component
11.4.4 Asia Pacific: Maritime Analytics Market Breakdown, by Deployment
11.4.4.1 Asia Pacific: Maritime Analytics Market– Revenue and Forecast Analysis – by Deployment
11.4.5 Asia Pacific: Maritime Analytics Market Breakdown, by Application
11.4.5.1 Asia Pacific: Maritime Analytics Market– Revenue and Forecast Analysis – by Application
11.4.6 Asia Pacific: Maritime Analytics Market Breakdown, by End User
11.4.6.1 Asia Pacific: Maritime Analytics Market– Revenue and Forecast Analysis – by End User
11.4.7 Asia Pacific: Maritime Analytics Market – Revenue and Forecast Analysis – by Country
11.4.7.1 Asia Pacific: Maritime Analytics Market – Revenue and Forecast Analysis – by Country
11.4.7.2 China: Maritime Analytics Market – Revenue, 2021 - 2031 (US$ Million)
11.4.7.2.1 China: Maritime Analytics Market Breakdown, by Component
11.4.7.2.2 China: Maritime Analytics Market Breakdown, by Deployment
11.4.7.2.3 China: Maritime Analytics Market Breakdown, by Application
11.4.7.2.4 China: Maritime Analytics Market Breakdown, by End User
11.4.7.3 Japan: Maritime Analytics Market – Revenue, 2021 - 2031 (US$ Million)
11.4.7.3.1 Japan: Maritime Analytics Market Breakdown, by Component
11.4.7.3.2 Japan: Maritime Analytics Market Breakdown, by Deployment
11.4.7.3.3 Japan: Maritime Analytics Market Breakdown, by Application
11.4.7.3.4 Japan: Maritime Analytics Market Breakdown, by End User
11.4.7.4 India: Maritime Analytics Market – Revenue, 2021 - 2031 (US$ Million)
11.4.7.4.1 India: Maritime Analytics Market Breakdown, by Component
11.4.7.4.2 India: Maritime Analytics Market Breakdown, by Deployment
11.4.7.4.3 India: Maritime Analytics Market Breakdown, by Application
11.4.7.4.4 India: Maritime Analytics Market Breakdown, by End User
11.4.7.5 South Korea: Maritime Analytics Market – Revenue, 2021 - 2031 (US$ Million)
11.4.7.5.1 South Korea: Maritime Analytics Market Breakdown, by Component
11.4.7.5.2 South Korea: Maritime Analytics Market Breakdown, by Deployment
11.4.7.5.3 South Korea: Maritime Analytics Market Breakdown, by Application
11.4.7.5.4 South Korea: Maritime Analytics Market Breakdown, by End User
11.4.7.6 Australia: Maritime Analytics Market – Revenue, 2021 - 2031 (US$ Million)
11.4.7.6.1 Australia: Maritime Analytics Market Breakdown, by Component
11.4.7.6.2 Australia: Maritime Analytics Market Breakdown, by Deployment
11.4.7.6.3 Australia: Maritime Analytics Market Breakdown, by Application
11.4.7.6.4 Australia: Maritime Analytics Market Breakdown, by End User
11.4.7.7 Rest of APAC: Maritime Analytics Market – Revenue, 2021 - 2031 (US$ Million)
11.4.7.7.1 Rest of APAC: Maritime Analytics Market Breakdown, by Component
11.4.7.7.2 Rest of APAC: Maritime Analytics Market Breakdown, by Deployment
11.4.7.7.3 Rest of APAC: Maritime Analytics Market Breakdown, by Application
11.4.7.7.4 Rest of APAC: Maritime Analytics Market Breakdown, by End User
11.5 Middle East and Africa
11.5.1 Middle East and Africa Maritime Analytics Market Overview
11.5.2 Middle East and Africa: Maritime Analytics Market – Revenue, 2021 - 2031 (US$ Million)
11.5.3 Middle East and Africa: Maritime Analytics Market Breakdown, by Component
11.5.3.1 Middle East and Africa: Maritime Analytics Market– Revenue and Forecast Analysis – by Component
11.5.4 Middle East and Africa: Maritime Analytics Market Breakdown, by Deployment
11.5.4.1 Middle East and Africa: Maritime Analytics Market– Revenue and Forecast Analysis – by Deployment
11.5.5 Middle East and Africa: Maritime Analytics Market Breakdown, by Application
11.5.5.1 Middle East and Africa: Maritime Analytics Market– Revenue and Forecast Analysis – by Application
11.5.6 Middle East and Africa: Maritime Analytics Market Breakdown, by End User
11.5.6.1 Middle East and Africa: Maritime Analytics Market– Revenue and Forecast Analysis – by End User
11.5.7 Middle East and Africa: Maritime Analytics Market – Revenue and Forecast Analysis – by Country
11.5.7.1 Middle East and Africa: Maritime Analytics Market – Revenue and Forecast Analysis – by Country
11.5.7.2 Saudi Arabia: Maritime Analytics Market – Revenue, 2021 - 2031 (US$ Million)
11.5.7.2.1 Saudi Arabia: Maritime Analytics Market Breakdown, by Component
11.5.7.2.2 Saudi Arabia: Maritime Analytics Market Breakdown, by Deployment
11.5.7.2.3 Saudi Arabia: Maritime Analytics Market Breakdown, by Application
11.5.7.2.4 Saudi Arabia: Maritime Analytics Market Breakdown, by End User
11.5.7.3 United Arab Emirates: Maritime Analytics Market – Revenue, 2021 - 2031 (US$ Million)
11.5.7.3.1 United Arab Emirates: Maritime Analytics Market Breakdown, by Component
11.5.7.3.2 United Arab Emirates: Maritime Analytics Market Breakdown, by Deployment
11.5.7.3.3 United Arab Emirates: Maritime Analytics Market Breakdown, by Application
11.5.7.3.4 United Arab Emirates: Maritime Analytics Market Breakdown, by End User
11.5.7.4 South Africa: Maritime Analytics Market – Revenue, 2021 - 2031 (US$ Million)
11.5.7.4.1 South Africa: Maritime Analytics Market Breakdown, by Component
11.5.7.4.2 South Africa: Maritime Analytics Market Breakdown, by Deployment
11.5.7.4.3 South Africa: Maritime Analytics Market Breakdown, by Application
11.5.7.4.4 South Africa: Maritime Analytics Market Breakdown, by End User
11.5.7.5 Rest of Middle East and Africa: Maritime Analytics Market – Revenue, 2021 - 2031 (US$ Million)
11.5.7.5.1 Rest of Middle East and Africa: Maritime Analytics Market Breakdown, by Component
11.5.7.5.2 Rest of Middle East and Africa: Maritime Analytics Market Breakdown, by Deployment
11.5.7.5.3 Rest of Middle East and Africa: Maritime Analytics Market Breakdown, by Application
11.5.7.5.4 Rest of Middle East and Africa: Maritime Analytics Market Breakdown, by End User
11.6 South and Central America
11.6.1 South and Central America Maritime Analytics Market Overview
11.6.2 South and Central America: Maritime Analytics Market – Revenue, 2021 - 2031 (US$ Million)
11.6.3 South and Central America: Maritime Analytics Market Breakdown, by Component
11.6.3.1 South and Central America: Maritime Analytics Market– Revenue and Forecast Analysis – by Component
11.6.4 South and Central America: Maritime Analytics Market Breakdown, by Deployment
11.6.4.1 South and Central America: Maritime Analytics Market– Revenue and Forecast Analysis – by Deployment
11.6.5 South and Central America: Maritime Analytics Market Breakdown, by Application
11.6.5.1 South and Central America: Maritime Analytics Market– Revenue and Forecast Analysis – by Application
11.6.6 South and Central America: Maritime Analytics Market Breakdown, by End User
11.6.6.1 South and Central America: Maritime Analytics Market– Revenue and Forecast Analysis – by End User
11.6.7 South and Central America: Maritime Analytics Market – Revenue and Forecast Analysis – by Country
11.6.7.1 South and Central America: Maritime Analytics Market – Revenue and Forecast Analysis – by Country
11.6.7.2 Brazil: Maritime Analytics Market – Revenue, 2021 - 2031 (US$ Million)
11.6.7.2.1 Brazil: Maritime Analytics Market Breakdown, by Component
11.6.7.2.2 Brazil: Maritime Analytics Market Breakdown, by Deployment
11.6.7.2.3 Brazil: Maritime Analytics Market Breakdown, by Application
11.6.7.2.4 Brazil: Maritime Analytics Market Breakdown, by End User
11.6.7.3 Argentina: Maritime Analytics Market – Revenue, 2021 - 2031 (US$ Million)
11.6.7.3.1 Argentina: Maritime Analytics Market Breakdown, by Component
11.6.7.3.2 Argentina: Maritime Analytics Market Breakdown, by Deployment
11.6.7.3.3 Argentina: Maritime Analytics Market Breakdown, by Application
11.6.7.3.4 Argentina: Maritime Analytics Market Breakdown, by End User
11.6.7.4 Rest of South and Central America: Maritime Analytics Market – Revenue, 2021 - 2031 (US$ Million)
11.6.7.4.1 Rest of South and Central America: Maritime Analytics Market Breakdown, by Component
11.6.7.4.2 Rest of South and Central America: Maritime Analytics Market Breakdown, by Deployment
11.6.7.4.3 Rest of South and Central America: Maritime Analytics Market Breakdown, by Application
11.6.7.4.4 Rest of South and Central America: Maritime Analytics Market Breakdown, by End User
12. Competitive Landscape
12.1 Heat Map Analysis by Key Players
12.2 Company Positioning & Concentration
12.3 Company Market Share Analysis, 2024
13. Industry Landscape
13.1 Overview
13.2 Market Initiative
13.3 Product Development
13.2 Mergers and Acquisitions
14. Company Profiles
14.1 Maritech Holdings Limited
14.1.1 Key Facts
14.1.2 Business Description
14.1.3 Products and Services
14.1.4 Financial Overview
14.1.5 SWOT Analysis
14.1.6 Key Developments
14.2 ShipNet
14.2.1 Key Facts
14.2.2 Business Description
14.2.3 Products and Services
14.2.4 Financial Overview
14.2.5 SWOT Analysis
14.2.6 Key Developments
14.3 Windward Ltd
14.3.1 Key Facts
14.3.2 Business Description
14.3.3 Products and Services
14.3.4 Financial Overview
14.3.5 SWOT Analysis
14.3.6 Key Developments
14.4 Kpler
14.4.1 Key Facts
14.4.2 Business Description
14.4.3 Products and Services
14.4.4 Financial Overview
14.4.5 SWOT Analysis
14.4.6 Key Developments
14.5 OrbitMI, Inc.
14.5.1 Key Facts
14.5.2 Business Description
14.5.3 Products and Services
14.5.4 Financial Overview
14.5.5 SWOT Analysis
14.5.6 Key Developments
14.6 ZeroNorth A/S
14.6.1 Key Facts
14.6.2 Business Description
14.6.3 Products and Services
14.6.4 Financial Overview
14.6.5 SWOT Analysis
14.6.6 Key Developments
14.7 SOLITWORK A/S
14.7.1 Key Facts
14.7.2 Business Description
14.7.3 Products and Services
14.7.4 Financial Overview
14.7.5 SWOT Analysis
14.7.6 Key Developments
14.8 Viasat Inc
14.8.1 Key Facts
14.8.2 Business Description
14.8.3 Products and Services
14.8.4 Financial Overview
14.8.5 SWOT Analysis
14.8.6 Key Developments
14.9 Hexagon AB
14.9.1 Key Facts
14.9.2 Business Description
14.9.3 Products and Services
14.9.4 Financial Overview
14.9.5 SWOT Analysis
14.9.6 Key Developments
14.10 ABB Ltd
14.10.1 Key Facts
14.10.2 Business Description
14.10.3 Products and Services
14.10.4 Financial Overview
14.10.5 SWOT Analysis
14.10.6 Key Developments
15. Appendix
15.1 Word Index
15.2 About the Insight Partners
List of Tables
Table 1. Maritime Analytics Market Segmentation
Table 2. List of Vendors
Table 3. Maritime Analytics Market – Revenue, 2021- 2024 (US$ Million)
Table 4. Maritime Analytics Market – Revenue, 2025- 2031 (US$ Million)
Table 5. Maritime Analytics Market – Revenue, 2021 -2024(US$ Million) – by Component
Table 6. Maritime Analytics Market – Revenue, 2025 - 2031(US$ Million) – by Component
Table 7. Maritime Analytics Market – Revenue, 2021 -2024(US$ Million) – by Deployment
Table 8. Maritime Analytics Market – Revenue, 2025 - 2031(US$ Million) – by Deployment
Table 9. Maritime Analytics Market – Revenue, 2021 -2024(US$ Million) – by Application
Table 10. Maritime Analytics Market – Revenue, 2025 - 2031(US$ Million) – by Application
Table 11. Maritime Analytics Market – Revenue, 2021 -2024(US$ Million) – by End User
Table 12. Maritime Analytics Market – Revenue, 2025 - 2031(US$ Million) – by End User
Table 13. North America: Maritime Analytics Market – Revenue, 2021 - 2024 (US$ Million) – by Component
Table 14. North America: Maritime Analytics Market – Revenue, 2025 - 2031 (US$ Million) – by Component
Table 15. North America: Maritime Analytics Market – Revenue, 2021 - 2024 (US$ Million) – by Deployment
Table 16. North America: Maritime Analytics Market – Revenue, 2025 - 2031 (US$ Million) – by Deployment
Table 17. North America: Maritime Analytics Market – Revenue, 2021 - 2024 (US$ Million) – by Application
Table 18. North America: Maritime Analytics Market – Revenue, 2025 - 2031 (US$ Million) – by Application
Table 19. North America: Maritime Analytics Market – Revenue, 2021 - 2024 (US$ Million) – by End User
Table 20. North America: Maritime Analytics Market – Revenue, 2025 - 2031 (US$ Million) – by End User
Table 21. North America: Maritime Analytics Market – Revenue, 2021 - 2024 (US$ Million) – by Country
Table 22. North America: Maritime Analytics Market – Revenue, 2025 - 2031 (US$ Million) – by Country
Table 23. United States: Maritime Analytics Market – Revenue, 2021 -2024(US$ Million) – by Component
Table 24. United States: Maritime Analytics Market – Revenue, 2025 - 2031 (US$ Million) – by Component
Table 25. United States: Maritime Analytics Market – Revenue, 2021 -2024(US$ Million) – by Deployment
Table 26. United States: Maritime Analytics Market – Revenue, 2025 - 2031 (US$ Million) – by Deployment
Table 27. United States: Maritime Analytics Market – Revenue, 2021 -2024(US$ Million) – by Application
Table 28. United States: Maritime Analytics Market – Revenue, 2025 - 2031 (US$ Million) – by Application
Table 29. United States: Maritime Analytics Market – Revenue, 2021 -2024(US$ Million) – by End User
Table 30. United States: Maritime Analytics Market – Revenue, 2025 - 2031 (US$ Million) – by End User
Table 31. Canada: Maritime Analytics Market – Revenue, 2021 -2024(US$ Million) – by Component
Table 32. Canada: Maritime Analytics Market – Revenue, 2025 - 2031 (US$ Million) – by Component
Table 33. Canada: Maritime Analytics Market – Revenue, 2021 -2024(US$ Million) – by Deployment
Table 34. Canada: Maritime Analytics Market – Revenue, 2025 - 2031 (US$ Million) – by Deployment
Table 35. Canada: Maritime Analytics Market – Revenue, 2021 -2024(US$ Million) – by Application
Table 36. Canada: Maritime Analytics Market – Revenue, 2025 - 2031 (US$ Million) – by Application
Table 37. Canada: Maritime Analytics Market – Revenue, 2021 -2024(US$ Million) – by End User
Table 38. Canada: Maritime Analytics Market – Revenue, 2025 - 2031 (US$ Million) – by End User
Table 39. Mexico: Maritime Analytics Market – Revenue, 2021 -2024(US$ Million) – by Component
Table 40. Mexico: Maritime Analytics Market – Revenue, 2025 - 2031 (US$ Million) – by Component
Table 41. Mexico: Maritime Analytics Market – Revenue, 2021 -2024(US$ Million) – by Deployment
Table 42. Mexico: Maritime Analytics Market – Revenue, 2025 - 2031 (US$ Million) – by Deployment
Table 43. Mexico: Maritime Analytics Market – Revenue, 2021 -2024(US$ Million) – by Application
Table 44. Mexico: Maritime Analytics Market – Revenue, 2025 - 2031 (US$ Million) – by Application
Table 45. Mexico: Maritime Analytics Market – Revenue, 2021 -2024(US$ Million) – by End User
Table 46. Mexico: Maritime Analytics Market – Revenue, 2025 - 2031 (US$ Million) – by End User
Table 47. Europe: Maritime Analytics Market – Revenue, 2021 - 2024 (US$ Million) – by Component
Table 48. Europe: Maritime Analytics Market – Revenue, 2025 - 2031 (US$ Million) – by Component
Table 49. Europe: Maritime Analytics Market – Revenue, 2021 - 2024 (US$ Million) – by Deployment
Table 50. Europe: Maritime Analytics Market – Revenue, 2025 - 2031 (US$ Million) – by Deployment
Table 51. Europe: Maritime Analytics Market – Revenue, 2021 - 2024 (US$ Million) – by Application
Table 52. Europe: Maritime Analytics Market – Revenue, 2025 - 2031 (US$ Million) – by Application
Table 53. Europe: Maritime Analytics Market – Revenue, 2021 - 2024 (US$ Million) – by End User
Table 54. Europe: Maritime Analytics Market – Revenue, 2025 - 2031 (US$ Million) – by End User
Table 55. Europe: Maritime Analytics Market – Revenue, 2021 - 2024 (US$ Million) – by Country
Table 56. Europe: Maritime Analytics Market – Revenue, 2025 - 2031 (US$ Million) – by Country
Table 57. United Kingdom: Maritime Analytics Market – Revenue, 2021 -2024(US$ Million) – by Component
Table 58. United Kingdom: Maritime Analytics Market – Revenue, 2025 - 2031 (US$ Million) – by Component
Table 59. United Kingdom: Maritime Analytics Market – Revenue, 2021 -2024(US$ Million) – by Deployment
Table 60. United Kingdom: Maritime Analytics Market – Revenue, 2025 - 2031 (US$ Million) – by Deployment
Table 61. United Kingdom: Maritime Analytics Market – Revenue, 2021 -2024(US$ Million) – by Application
Table 62. United Kingdom: Maritime Analytics Market – Revenue, 2025 - 2031 (US$ Million) – by Application
Table 63. United Kingdom: Maritime Analytics Market – Revenue, 2021 -2024(US$ Million) – by End User
Table 64. United Kingdom: Maritime Analytics Market – Revenue, 2025 - 2031 (US$ Million) – by End User
Table 65. Germany: Maritime Analytics Market – Revenue, 2021 -2024(US$ Million) – by Component
Table 66. Germany: Maritime Analytics Market – Revenue, 2025 - 2031 (US$ Million) – by Component
Table 67. Germany: Maritime Analytics Market – Revenue, 2021 -2024(US$ Million) – by Deployment
Table 68. Germany: Maritime Analytics Market – Revenue, 2025 - 2031 (US$ Million) – by Deployment
Table 69. Germany: Maritime Analytics Market – Revenue, 2021 -2024(US$ Million) – by Application
Table 70. Germany: Maritime Analytics Market – Revenue, 2025 - 2031 (US$ Million) – by Application
Table 71. Germany: Maritime Analytics Market – Revenue, 2021 -2024(US$ Million) – by End User
Table 72. Germany: Maritime Analytics Market – Revenue, 2025 - 2031 (US$ Million) – by End User
Table 73. France: Maritime Analytics Market – Revenue, 2021 -2024(US$ Million) – by Component
Table 74. France: Maritime Analytics Market – Revenue, 2025 - 2031 (US$ Million) – by Component
Table 75. France: Maritime Analytics Market – Revenue, 2021 -2024(US$ Million) – by Deployment
Table 76. France: Maritime Analytics Market – Revenue, 2025 - 2031 (US$ Million) – by Deployment
Table 77. France: Maritime Analytics Market – Revenue, 2021 -2024(US$ Million) – by Application
Table 78. France: Maritime Analytics Market – Revenue, 2025 - 2031 (US$ Million) – by Application
Table 79. France: Maritime Analytics Market – Revenue, 2021 -2024(US$ Million) – by End User
Table 80. France: Maritime Analytics Market – Revenue, 2025 - 2031 (US$ Million) – by End User
Table 81. Italy: Maritime Analytics Market – Revenue, 2021 -2024(US$ Million) – by Component
Table 82. Italy: Maritime Analytics Market – Revenue, 2025 - 2031 (US$ Million) – by Component
Table 83. Italy: Maritime Analytics Market – Revenue, 2021 -2024(US$ Million) – by Deployment
Table 84. Italy: Maritime Analytics Market – Revenue, 2025 - 2031 (US$ Million) – by Deployment
Table 85. Italy: Maritime Analytics Market – Revenue, 2021 -2024(US$ Million) – by Application
Table 86. Italy: Maritime Analytics Market – Revenue, 2025 - 2031 (US$ Million) – by Application
Table 87. Italy: Maritime Analytics Market – Revenue, 2021 -2024(US$ Million) – by End User
Table 88. Italy: Maritime Analytics Market – Revenue, 2025 - 2031 (US$ Million) – by End User
Table 89. Russia: Maritime Analytics Market – Revenue, 2021 -2024(US$ Million) – by Component
Table 90. Russia: Maritime Analytics Market – Revenue, 2025 - 2031 (US$ Million) – by Component
Table 91. Russia: Maritime Analytics Market – Revenue, 2021 -2024(US$ Million) – by Deployment
Table 92. Russia: Maritime Analytics Market – Revenue, 2025 - 2031 (US$ Million) – by Deployment
Table 93. Russia: Maritime Analytics Market – Revenue, 2021 -2024(US$ Million) – by Application
Table 94. Russia: Maritime Analytics Market – Revenue, 2025 - 2031 (US$ Million) – by Application
Table 95. Russia: Maritime Analytics Market – Revenue, 2021 -2024(US$ Million) – by End User
Table 96. Russia: Maritime Analytics Market – Revenue, 2025 - 2031 (US$ Million) – by End User
Table 97. Rest of Europe: Maritime Analytics Market – Revenue, 2021 -2024(US$ Million) – by Component
Table 98. Rest of Europe: Maritime Analytics Market – Revenue, 2025 - 2031 (US$ Million) – by Component
Table 99. Rest of Europe: Maritime Analytics Market – Revenue, 2021 -2024(US$ Million) – by Deployment
Table 100. Rest of Europe: Maritime Analytics Market – Revenue, 2025 - 2031 (US$ Million) – by Deployment
Table 101. Rest of Europe: Maritime Analytics Market – Revenue, 2021 -2024(US$ Million) – by Application
Table 102. Rest of Europe: Maritime Analytics Market – Revenue, 2025 - 2031 (US$ Million) – by Application
Table 103. Rest of Europe: Maritime Analytics Market – Revenue, 2021 -2024(US$ Million) – by End User
Table 104. Rest of Europe: Maritime Analytics Market – Revenue, 2025 - 2031 (US$ Million) – by End User
Table 105. Asia Pacific: Maritime Analytics Market – Revenue, 2021 - 2024 (US$ Million) – by Component
Table 106. Asia Pacific: Maritime Analytics Market – Revenue, 2025 - 2031 (US$ Million) – by Component
Table 107. Asia Pacific: Maritime Analytics Market – Revenue, 2021 - 2024 (US$ Million) – by Deployment
Table 108. Asia Pacific: Maritime Analytics Market – Revenue, 2025 - 2031 (US$ Million) – by Deployment
Table 109. Asia Pacific: Maritime Analytics Market – Revenue, 2021 - 2024 (US$ Million) – by Application
Table 110. Asia Pacific: Maritime Analytics Market – Revenue, 2025 - 2031 (US$ Million) – by Application
Table 111. Asia Pacific: Maritime Analytics Market – Revenue, 2021 - 2024 (US$ Million) – by End User
Table 112. Asia Pacific: Maritime Analytics Market – Revenue, 2025 - 2031 (US$ Million) – by End User
Table 113. Asia Pacific: Maritime Analytics Market – Revenue, 2021 - 2024 (US$ Million) – by Country
Table 114. Asia Pacific: Maritime Analytics Market – Revenue, 2025 - 2031 (US$ Million) – by Country
Table 115. China: Maritime Analytics Market – Revenue, 2021 -2024(US$ Million) – by Component
Table 116. China: Maritime Analytics Market – Revenue, 2025 - 2031 (US$ Million) – by Component
Table 117. China: Maritime Analytics Market – Revenue, 2021 -2024(US$ Million) – by Deployment
Table 118. China: Maritime Analytics Market – Revenue, 2025 - 2031 (US$ Million) – by Deployment
Table 119. China: Maritime Analytics Market – Revenue, 2021 -2024(US$ Million) – by Application
Table 120. China: Maritime Analytics Market – Revenue, 2025 - 2031 (US$ Million) – by Application
Table 121. China: Maritime Analytics Market – Revenue, 2021 -2024(US$ Million) – by End User
Table 122. China: Maritime Analytics Market – Revenue, 2025 - 2031 (US$ Million) – by End User
Table 123. Japan: Maritime Analytics Market – Revenue, 2021 -2024(US$ Million) – by Component
Table 124. Japan: Maritime Analytics Market – Revenue, 2025 - 2031 (US$ Million) – by Component
Table 125. Japan: Maritime Analytics Market – Revenue, 2021 -2024(US$ Million) – by Deployment
Table 126. Japan: Maritime Analytics Market – Revenue, 2025 - 2031 (US$ Million) – by Deployment
Table 127. Japan: Maritime Analytics Market – Revenue, 2021 -2024(US$ Million) – by Application
Table 128. Japan: Maritime Analytics Market – Revenue, 2025 - 2031 (US$ Million) – by Application
Table 129. Japan: Maritime Analytics Market – Revenue, 2021 -2024(US$ Million) – by End User
Table 130. Japan: Maritime Analytics Market – Revenue, 2025 - 2031 (US$ Million) – by End User
Table 131. India: Maritime Analytics Market – Revenue, 2021 -2024(US$ Million) – by Component
Table 132. India: Maritime Analytics Market – Revenue, 2025 - 2031 (US$ Million) – by Component
Table 133. India: Maritime Analytics Market – Revenue, 2021 -2024(US$ Million) – by Deployment
Table 134. India: Maritime Analytics Market – Revenue, 2025 - 2031 (US$ Million) – by Deployment
Table 135. India: Maritime Analytics Market – Revenue, 2021 -2024(US$ Million) – by Application
Table 136. India: Maritime Analytics Market – Revenue, 2025 - 2031 (US$ Million) – by Application
Table 137. India: Maritime Analytics Market – Revenue, 2021 -2024(US$ Million) – by End User
Table 138. India: Maritime Analytics Market – Revenue, 2025 - 2031 (US$ Million) – by End User
Table 139. South Korea: Maritime Analytics Market – Revenue, 2021 -2024(US$ Million) – by Component
Table 140. South Korea: Maritime Analytics Market – Revenue, 2025 - 2031 (US$ Million) – by Component
Table 141. South Korea: Maritime Analytics Market – Revenue, 2021 -2024(US$ Million) – by Deployment
Table 142. South Korea: Maritime Analytics Market – Revenue, 2025 - 2031 (US$ Million) – by Deployment
Table 143. South Korea: Maritime Analytics Market – Revenue, 2021 -2024(US$ Million) – by Application
Table 144. South Korea: Maritime Analytics Market – Revenue, 2025 - 2031 (US$ Million) – by Application
Table 145. South Korea: Maritime Analytics Market – Revenue, 2021 -2024(US$ Million) – by End User
Table 146. South Korea: Maritime Analytics Market – Revenue, 2025 - 2031 (US$ Million) – by End User
Table 147. Australia: Maritime Analytics Market – Revenue, 2021 -2024(US$ Million) – by Component
Table 148. Australia: Maritime Analytics Market – Revenue, 2025 - 2031 (US$ Million) – by Component
Table 149. Australia: Maritime Analytics Market – Revenue, 2021 -2024(US$ Million) – by Deployment
Table 150. Australia: Maritime Analytics Market – Revenue, 2025 - 2031 (US$ Million) – by Deployment
Table 151. Australia: Maritime Analytics Market – Revenue, 2021 -2024(US$ Million) – by Application
Table 152. Australia: Maritime Analytics Market – Revenue, 2025 - 2031 (US$ Million) – by Application
Table 153. Australia: Maritime Analytics Market – Revenue, 2021 -2024(US$ Million) – by End User
Table 154. Australia: Maritime Analytics Market – Revenue, 2025 - 2031 (US$ Million) – by End User
Table 155. Rest of APAC: Maritime Analytics Market – Revenue, 2021 -2024(US$ Million) – by Component
Table 156. Rest of APAC: Maritime Analytics Market – Revenue, 2025 - 2031 (US$ Million) – by Component
Table 157. Rest of APAC: Maritime Analytics Market – Revenue, 2021 -2024(US$ Million) – by Deployment
Table 158. Rest of APAC: Maritime Analytics Market – Revenue, 2025 - 2031 (US$ Million) – by Deployment
Table 159. Rest of APAC: Maritime Analytics Market – Revenue, 2021 -2024(US$ Million) – by Application
Table 160. Rest of APAC: Maritime Analytics Market – Revenue, 2025 - 2031 (US$ Million) – by Application
Table 161. Rest of APAC: Maritime Analytics Market – Revenue, 2021 -2024(US$ Million) – by End User
Table 162. Rest of APAC: Maritime Analytics Market – Revenue, 2025 - 2031 (US$ Million) – by End User
Table 163. Middle East and Africa: Maritime Analytics Market – Revenue, 2021 - 2024 (US$ Million) – by Component
Table 164. Middle East and Africa: Maritime Analytics Market – Revenue, 2025 - 2031 (US$ Million) – by Component
Table 165. Middle East and Africa: Maritime Analytics Market – Revenue, 2021 - 2024 (US$ Million) – by Deployment
Table 166. Middle East and Africa: Maritime Analytics Market – Revenue, 2025 - 2031 (US$ Million) – by Deployment
Table 167. Middle East and Africa: Maritime Analytics Market – Revenue, 2021 - 2024 (US$ Million) – by Application
Table 168. Middle East and Africa: Maritime Analytics Market – Revenue, 2025 - 2031 (US$ Million) – by Application
Table 169. Middle East and Africa: Maritime Analytics Market – Revenue, 2021 - 2024 (US$ Million) – by End User
Table 170. Middle East and Africa: Maritime Analytics Market – Revenue, 2025 - 2031 (US$ Million) – by End User
Table 171. Middle East and Africa: Maritime Analytics Market – Revenue, 2021 - 2024 (US$ Million) – by Country
Table 172. Middle East and Africa: Maritime Analytics Market – Revenue, 2025 - 2031 (US$ Million) – by Country
Table 173. Saudi Arabia: Maritime Analytics Market – Revenue, 2021 -2024(US$ Million) – by Component
Table 174. Saudi Arabia: Maritime Analytics Market – Revenue, 2025 - 2031 (US$ Million) – by Component
Table 175. Saudi Arabia: Maritime Analytics Market – Revenue, 2021 -2024(US$ Million) – by Deployment
Table 176. Saudi Arabia: Maritime Analytics Market – Revenue, 2025 - 2031 (US$ Million) – by Deployment
Table 177. Saudi Arabia: Maritime Analytics Market – Revenue, 2021 -2024(US$ Million) – by Application
Table 178. Saudi Arabia: Maritime Analytics Market – Revenue, 2025 - 2031 (US$ Million) – by Application
Table 179. Saudi Arabia: Maritime Analytics Market – Revenue, 2021 -2024(US$ Million) – by End User
Table 180. Saudi Arabia: Maritime Analytics Market – Revenue, 2025 - 2031 (US$ Million) – by End User
Table 181. United Arab Emirates: Maritime Analytics Market – Revenue, 2021 -2024(US$ Million) – by Component
Table 182. United Arab Emirates: Maritime Analytics Market – Revenue, 2025 - 2031 (US$ Million) – by Component
Table 183. United Arab Emirates: Maritime Analytics Market – Revenue, 2021 -2024(US$ Million) – by Deployment
Table 184. United Arab Emirates: Maritime Analytics Market – Revenue, 2025 - 2031 (US$ Million) – by Deployment
Table 185. United Arab Emirates: Maritime Analytics Market – Revenue, 2021 -2024(US$ Million) – by Application
Table 186. United Arab Emirates: Maritime Analytics Market – Revenue, 2025 - 2031 (US$ Million) – by Application
Table 187. United Arab Emirates: Maritime Analytics Market – Revenue, 2021 -2024(US$ Million) – by End User
Table 188. United Arab Emirates: Maritime Analytics Market – Revenue, 2025 - 2031 (US$ Million) – by End User
Table 189. South Africa: Maritime Analytics Market – Revenue, 2021 -2024(US$ Million) – by Component
Table 190. South Africa: Maritime Analytics Market – Revenue, 2025 - 2031 (US$ Million) – by Component
Table 191. South Africa: Maritime Analytics Market – Revenue, 2021 -2024(US$ Million) – by Deployment
Table 192. South Africa: Maritime Analytics Market – Revenue, 2025 - 2031 (US$ Million) – by Deployment
Table 193. South Africa: Maritime Analytics Market – Revenue, 2021 -2024(US$ Million) – by Application
Table 194. South Africa: Maritime Analytics Market – Revenue, 2025 - 2031 (US$ Million) – by Application
Table 195. South Africa: Maritime Analytics Market – Revenue, 2021 -2024(US$ Million) – by End User
Table 196. South Africa: Maritime Analytics Market – Revenue, 2025 - 2031 (US$ Million) – by End User
Table 197. Rest of Middle East and Africa: Maritime Analytics Market – Revenue, 2021 -2024(US$ Million) – by Component
Table 198. Rest of Middle East and Africa: Maritime Analytics Market – Revenue, 2025 - 2031 (US$ Million) – by Component
Table 199. Rest of Middle East and Africa: Maritime Analytics Market – Revenue, 2021 -2024(US$ Million) – by Deployment
Table 200. Rest of Middle East and Africa: Maritime Analytics Market – Revenue, 2025 - 2031 (US$ Million) – by Deployment
Table 201. Rest of Middle East and Africa: Maritime Analytics Market – Revenue, 2021 -2024(US$ Million) – by Application
Table 202. Rest of Middle East and Africa: Maritime Analytics Market – Revenue, 2025 - 2031 (US$ Million) – by Application
Table 203. Rest of Middle East and Africa: Maritime Analytics Market – Revenue, 2021 -2024(US$ Million) – by End User
Table 204. Rest of Middle East and Africa: Maritime Analytics Market – Revenue, 2025 - 2031 (US$ Million) – by End User
Table 205. South and Central America: Maritime Analytics Market – Revenue, 2021 - 2024 (US$ Million) – by Component
Table 206. South and Central America: Maritime Analytics Market – Revenue, 2025 - 2031 (US$ Million) – by Component
Table 207. South and Central America: Maritime Analytics Market – Revenue, 2021 - 2024 (US$ Million) – by Deployment
Table 208. South and Central America: Maritime Analytics Market – Revenue, 2025 - 2031 (US$ Million) – by Deployment
Table 209. South and Central America: Maritime Analytics Market – Revenue, 2021 - 2024 (US$ Million) – by Application
Table 210. South and Central America: Maritime Analytics Market – Revenue, 2025 - 2031 (US$ Million) – by Application
Table 211. South and Central America: Maritime Analytics Market – Revenue, 2021 - 2024 (US$ Million) – by End User
Table 212. South and Central America: Maritime Analytics Market – Revenue, 2025 - 2031 (US$ Million) – by End User
Table 213. South and Central America: Maritime Analytics Market – Revenue, 2021 - 2024 (US$ Million) – by Country
Table 214. South and Central America: Maritime Analytics Market – Revenue, 2025 - 2031 (US$ Million) – by Country
Table 215. Brazil: Maritime Analytics Market – Revenue, 2021 -2024(US$ Million) – by Component
Table 216. Brazil: Maritime Analytics Market – Revenue, 2025 - 2031 (US$ Million) – by Component
Table 217. Brazil: Maritime Analytics Market – Revenue, 2021 -2024(US$ Million) – by Deployment
Table 218. Brazil: Maritime Analytics Market – Revenue, 2025 - 2031 (US$ Million) – by Deployment
Table 219. Brazil: Maritime Analytics Market – Revenue, 2021 -2024(US$ Million) – by Application
Table 220. Brazil: Maritime Analytics Market – Revenue, 2025 - 2031 (US$ Million) – by Application
Table 221. Brazil: Maritime Analytics Market – Revenue, 2021 -2024(US$ Million) – by End User
Table 222. Brazil: Maritime Analytics Market – Revenue, 2025 - 2031 (US$ Million) – by End User
Table 223. Argentina: Maritime Analytics Market – Revenue, 2021 -2024(US$ Million) – by Component
Table 224. Argentina: Maritime Analytics Market – Revenue, 2025 - 2031 (US$ Million) – by Component
Table 225. Argentina: Maritime Analytics Market – Revenue, 2021 -2024(US$ Million) – by Deployment
Table 226. Argentina: Maritime Analytics Market – Revenue, 2025 - 2031 (US$ Million) – by Deployment
Table 227. Argentina: Maritime Analytics Market – Revenue, 2021 -2024(US$ Million) – by Application
Table 228. Argentina: Maritime Analytics Market – Revenue, 2025 - 2031 (US$ Million) – by Application
Table 229. Argentina: Maritime Analytics Market – Revenue, 2021 -2024(US$ Million) – by End User
Table 230. Argentina: Maritime Analytics Market – Revenue, 2025 - 2031 (US$ Million) – by End User
Table 231. Rest of South and Central America: Maritime Analytics Market – Revenue, 2021 -2024(US$ Million) – by Component
Table 232. Rest of South and Central America: Maritime Analytics Market – Revenue, 2025 - 2031 (US$ Million) – by Component
Table 233. Rest of South and Central America: Maritime Analytics Market – Revenue, 2021 -2024(US$ Million) – by Deployment
Table 234. Rest of South and Central America: Maritime Analytics Market – Revenue, 2025 - 2031 (US$ Million) – by Deployment
Table 235. Rest of South and Central America: Maritime Analytics Market – Revenue, 2021 -2024(US$ Million) – by Application
Table 236. Rest of South and Central America: Maritime Analytics Market – Revenue, 2025 - 2031 (US$ Million) – by Application
Table 237. Rest of South and Central America: Maritime Analytics Market – Revenue, 2021 -2024(US$ Million) – by End User
Table 238. Rest of South and Central America: Maritime Analytics Market – Revenue, 2025 - 2031 (US$ Million) – by End User
Table 239. Company Positioning & Concentration
Table 240. List of Abbreviation
List of Figures
Figure 1. Maritime Analytics Market Segmentation, by Geography
Figure 2. PEST Analysis
Figure 3. Impact Analysis of Drivers and Restraints
Figure 4. Maritime Analytics Market Revenue (US$ Million), 2021–2031
Figure 5. Maritime Analytics Market Share (%) – by Component (2024 and 2031)
Figure 6. Software: Maritime Analytics Market – Revenue and Forecast to 2031 (US$ Million)
Figure 7. Services: Maritime Analytics Market – Revenue and Forecast to 2031 (US$ Million)
Figure 8. Maritime Analytics Market Share (%) – by Deployment (2024 and 2031)
Figure 9. Cloud: Maritime Analytics Market – Revenue and Forecast to 2031 (US$ Million)
Figure 10. On Premises: Maritime Analytics Market – Revenue and Forecast to 2031 (US$ Million)
Figure 11. Maritime Analytics Market Share (%) – by Application (2024 and 2031)
Figure 12. Predictive and Prescriptive Analytics: Maritime Analytics Market – Revenue and Forecast to 2031 (US$ Million)
Figure 13. Optimal Route Mapping: Maritime Analytics Market – Revenue and Forecast to 2031 (US$ Million)
Figure 14. Pricing Insights: Maritime Analytics Market – Revenue and Forecast to 2031 (US$ Million)
Figure 15. Vessel Safety and Security: Maritime Analytics Market – Revenue and Forecast to 2031 (US$ Million)
Figure 16. Others: Maritime Analytics Market – Revenue and Forecast to 2031 (US$ Million)
Figure 17. Maritime Analytics Market Share (%) – by End User (2024 and 2031)
Figure 18. Commercial: Maritime Analytics Market – Revenue and Forecast to 2031 (US$ Million)
Figure 19. Military: Maritime Analytics Market – Revenue and Forecast to 2031 (US$ Million)
Figure 20. Maritime Analytics Market Breakdown by Region, 2024 and 2031 (%)
Figure 21. North America: Maritime Analytics Market – Revenue, 2021 - 2031 (US$ Million)
Figure 22. North America: Maritime Analytics Market Breakdown, by Component (2024 and 2031)
Figure 23. North America: Maritime Analytics Market Breakdown, by Deployment (2024 and 2031)
Figure 24. North America: Maritime Analytics Market Breakdown, by Application (2024 and 2031)
Figure 25. North America: Maritime Analytics Market Breakdown, by End User (2024 and 2031)
Figure 26. North America: Maritime Analytics Market Breakdown, by Key Countries, 2024 and 2031 (%)
Figure 27. United States: Maritime Analytics Market – Revenue, 2021 - 2031 (US$ Million)
Figure 28. Canada: Maritime Analytics Market – Revenue, 2021 - 2031 (US$ Million)
Figure 29. Mexico: Maritime Analytics Market – Revenue, 2021 - 2031 (US$ Million)
Figure 30. Europe: Maritime Analytics Market – Revenue, 2021 - 2031 (US$ Million)
Figure 31. Europe: Maritime Analytics Market Breakdown, by Component (2024 and 2031)
Figure 32. Europe: Maritime Analytics Market Breakdown, by Deployment (2024 and 2031)
Figure 33. Europe: Maritime Analytics Market Breakdown, by Application (2024 and 2031)
Figure 34. Europe: Maritime Analytics Market Breakdown, by End User (2024 and 2031)
Figure 35. Europe: Maritime Analytics Market Breakdown, by Key Countries, 2024 and 2031 (%)
Figure 36. United Kingdom: Maritime Analytics Market – Revenue, 2021 - 2031 (US$ Million)
Figure 37. Germany: Maritime Analytics Market – Revenue, 2021 - 2031 (US$ Million)
Figure 38. France: Maritime Analytics Market – Revenue, 2021 - 2031 (US$ Million)
Figure 39. Italy: Maritime Analytics Market – Revenue, 2021 - 2031 (US$ Million)
Figure 40. Russia: Maritime Analytics Market – Revenue, 2021 - 2031 (US$ Million)
Figure 41. Rest of Europe: Maritime Analytics Market – Revenue, 2021 - 2031 (US$ Million)
Figure 42. Asia Pacific: Maritime Analytics Market – Revenue, 2021 - 2031 (US$ Million)
Figure 43. Asia Pacific: Maritime Analytics Market Breakdown, by Component (2024 and 2031)
Figure 44. Asia Pacific: Maritime Analytics Market Breakdown, by Deployment (2024 and 2031)
Figure 45. Asia Pacific: Maritime Analytics Market Breakdown, by Application (2024 and 2031)
Figure 46. Asia Pacific: Maritime Analytics Market Breakdown, by End User (2024 and 2031)
Figure 47. Asia Pacific: Maritime Analytics Market Breakdown, by Key Countries, 2024 and 2031 (%)
Figure 48. China: Maritime Analytics Market – Revenue, 2021 - 2031 (US$ Million)
Figure 49. Japan: Maritime Analytics Market – Revenue, 2021 - 2031 (US$ Million)
Figure 50. India: Maritime Analytics Market – Revenue, 2021 - 2031 (US$ Million)
Figure 51. South Korea: Maritime Analytics Market – Revenue, 2021 - 2031 (US$ Million)
Figure 52. Australia: Maritime Analytics Market – Revenue, 2021 - 2031 (US$ Million)
Figure 53. Rest of APAC: Maritime Analytics Market – Revenue, 2021 - 2031 (US$ Million)
Figure 54. Middle East and Africa: Maritime Analytics Market – Revenue, 2021 - 2031 (US$ Million)
Figure 55. Middle East and Africa: Maritime Analytics Market Breakdown, by Component (2024 and 2031)
Figure 56. Middle East and Africa: Maritime Analytics Market Breakdown, by Deployment (2024 and 2031)
Figure 57. Middle East and Africa: Maritime Analytics Market Breakdown, by Application (2024 and 2031)
Figure 58. Middle East and Africa: Maritime Analytics Market Breakdown, by End User (2024 and 2031)
Figure 59. Middle East and Africa: Maritime Analytics Market Breakdown, by Key Countries, 2024 and 2031 (%)
Figure 60. Saudi Arabia: Maritime Analytics Market – Revenue, 2021 - 2031 (US$ Million)
Figure 61. United Arab Emirates: Maritime Analytics Market – Revenue, 2021 - 2031 (US$ Million)
Figure 62. South Africa: Maritime Analytics Market – Revenue, 2021 - 2031 (US$ Million)
Figure 63. Rest of Middle East and Africa: Maritime Analytics Market – Revenue, 2021 - 2031 (US$ Million)
Figure 64. South and Central America: Maritime Analytics Market – Revenue, 2021 - 2031 (US$ Million)
Figure 65. South and Central America: Maritime Analytics Market Breakdown, by Component (2024 and 2031)
Figure 66. South and Central America: Maritime Analytics Market Breakdown, by Deployment (2024 and 2031)
Figure 67. South and Central America: Maritime Analytics Market Breakdown, by Application (2024 and 2031)
Figure 68. South and Central America: Maritime Analytics Market Breakdown, by End User (2024 and 2031)
Figure 69. South and Central America: Maritime Analytics Market Breakdown, by Key Countries, 2024 and 2031 (%)
Figure 70. Brazil: Maritime Analytics Market – Revenue, 2021 - 2031 (US$ Million)
Figure 71. Argentina: Maritime Analytics Market – Revenue, 2021 - 2031 (US$ Million)
Figure 72. Rest of South and Central America: Maritime Analytics Market – Revenue, 2021 - 2031 (US$ Million)
Figure 73. Heat Map Analysis by Key Players
Figure 74. Company Market Share Analysis, 2024
The List of Companies - Maritime Analytics Market
- Maritech Holdings Limited
- ShipNet
- Windward Ltd
- Kpler
- OrbitMI, Inc.
- ZeroNorth A/S
- SOLITWORK A/S
- Viasat Inc
- Hexagon AB
- ABB Ltd
The Insight Partners performs research in 4 major stages: Data Collection & Secondary Research, Primary Research, Data Analysis and Data Triangulation & Final Review.
- Data Collection and Secondary Research:
As a market research and consulting firm operating from a decade, we have published many reports and advised several clients across the globe. First step for any study will start with an assessment of currently available data and insights from existing reports. Further, historical and current market information is collected from Investor Presentations, Annual Reports, SEC Filings, etc., and other information related to company’s performance and market positioning are gathered from Paid Databases (Factiva, Hoovers, and Reuters) and various other publications available in public domain.
Several associations trade associates, technical forums, institutes, societies and organizations are accessed to gain technical as well as market related insights through their publications such as research papers, blogs and press releases related to the studies are referred to get cues about the market. Further, white papers, journals, magazines, and other news articles published in the last 3 years are scrutinized and analyzed to understand the current market trends.
- Primary Research:
The primarily interview analysis comprise of data obtained from industry participants interview and answers to survey questions gathered by in-house primary team.
For primary research, interviews are conducted with industry experts/CEOs/Marketing Managers/Sales Managers/VPs/Subject Matter Experts from both demand and supply side to get a 360-degree view of the market. The primary team conducts several interviews based on the complexity of the markets to understand the various market trends and dynamics which makes research more credible and precise.
A typical research interview fulfils the following functions:
- Provides first-hand information on the market size, market trends, growth trends, competitive landscape, and outlook
- Validates and strengthens in-house secondary research findings
- Develops the analysis team’s expertise and market understanding
Primary research involves email interactions and telephone interviews for each market, category, segment, and sub-segment across geographies. The participants who typically take part in such a process include, but are not limited to:
- Industry participants: VPs, business development managers, market intelligence managers and national sales managers
- Outside experts: Valuation experts, research analysts and key opinion leaders specializing in the electronics and semiconductor industry.
Below is the breakup of our primary respondents by company, designation, and region:

Once we receive the confirmation from primary research sources or primary respondents, we finalize the base year market estimation and forecast the data as per the macroeconomic and microeconomic factors assessed during data collection.
- Data Analysis:
Once data is validated through both secondary as well as primary respondents, we finalize the market estimations by hypothesis formulation and factor analysis at regional and country level.
- 3.1 Macro-Economic Factor Analysis:
We analyse macroeconomic indicators such the gross domestic product (GDP), increase in the demand for goods and services across industries, technological advancement, regional economic growth, governmental policies, the influence of COVID-19, PEST analysis, and other aspects. This analysis aids in setting benchmarks for various nations/regions and approximating market splits. Additionally, the general trend of the aforementioned components aid in determining the market's development possibilities.
- 3.2 Country Level Data:
Various factors that are especially aligned to the country are taken into account to determine the market size for a certain area and country, including the presence of vendors, such as headquarters and offices, the country's GDP, demand patterns, and industry growth. To comprehend the market dynamics for the nation, a number of growth variables, inhibitors, application areas, and current market trends are researched. The aforementioned elements aid in determining the country's overall market's growth potential.
- 3.3 Company Profile:
The “Table of Contents” is formulated by listing and analyzing more than 25 - 30 companies operating in the market ecosystem across geographies. However, we profile only 10 companies as a standard practice in our syndicate reports. These 10 companies comprise leading, emerging, and regional players. Nonetheless, our analysis is not restricted to the 10 listed companies, we also analyze other companies present in the market to develop a holistic view and understand the prevailing trends. The “Company Profiles” section in the report covers key facts, business description, products & services, financial information, SWOT analysis, and key developments. The financial information presented is extracted from the annual reports and official documents of the publicly listed companies. Upon collecting the information for the sections of respective companies, we verify them via various primary sources and then compile the data in respective company profiles. The company level information helps us in deriving the base number as well as in forecasting the market size.
- 3.4 Developing Base Number:
Aggregation of sales statistics (2020-2022) and macro-economic factor, and other secondary and primary research insights are utilized to arrive at base number and related market shares for 2022. The data gaps are identified in this step and relevant market data is analyzed, collected from paid primary interviews or databases. On finalizing the base year market size, forecasts are developed on the basis of macro-economic, industry and market growth factors and company level analysis.
- Data Triangulation and Final Review:
The market findings and base year market size calculations are validated from supply as well as demand side. Demand side validations are based on macro-economic factor analysis and benchmarks for respective regions and countries. In case of supply side validations, revenues of major companies are estimated (in case not available) based on industry benchmark, approximate number of employees, product portfolio, and primary interviews revenues are gathered. Further revenue from target product/service segment is assessed to avoid overshooting of market statistics. In case of heavy deviations between supply and demand side values, all thes steps are repeated to achieve synchronization.
We follow an iterative model, wherein we share our research findings with Subject Matter Experts (SME’s) and Key Opinion Leaders (KOLs) until consensus view of the market is not formulated – this model negates any drastic deviation in the opinions of experts. Only validated and universally acceptable research findings are quoted in our reports.
We have important check points that we use to validate our research findings – which we call – data triangulation, where we validate the information, we generate from secondary sources with primary interviews and then we re-validate with our internal data bases and Subject matter experts. This comprehensive model enables us to deliver high quality, reliable data in shortest possible time.
Trends and growth analysis reports related to Maritime Analytics Market

Apr 2025
Flight Planning Software Market
Size and Forecast (2021 - 2031), Global and Regional Share, Trend, and Growth Opportunity Analysis Report Coverage: By Component (Software and Services), Deployment (Cloud and On-Premise), Application (Logistics and Cargo, Airport, Private Airlines, Commercial Airlines, Flight School and Training Center, and Military and Defense), and Geography
Apr 2025
Deepfake AI Detection Market
Size and Forecast (2021 - 2031), Global and Regional Share, Trend, and Growth Opportunity Analysis Report Coverage: By Component (Software and Services), Deployment (Cloud and On-Premises), Enterprise Size (Large Enterprises and SMEs), Industry Vertical (Media and Entertainment, BFSI, Government and Politics, Healthcare and Life Sciences, IT and Telecom, Retail and E-Commerce, and Others), and Geography
Apr 2025
Electronic Patient-Reported Outcomes (ePROS) Market
Size and Forecast (2021 - 2031), Global and Regional Share, Trend, and Growth Opportunity Analysis Report Coverage: By Delivery Mode (Cloud Based and On-Premises), Application (Oncology, Respiratory, and Others), End User [Contract Research Organizations (CROs), Pharmaceutical Companies, and Others], and Geography (North America, Europe, Asia Pacific, Middle East & Africa, and South & Central America)
Apr 2025
Travel and Expense Management Software Market
Size and Forecast (2021 - 2031), Global and Regional Share, Trend, and Growth Opportunity Analysis Report Coverage: By Deployment Mode (On-Premise and Cloud), Organization Size (Large Enterprises and Small and Medium Enterprises), Industry (BFSI, IT and Telecom, Manufacturing, Healthcare, Government and Defense, Retail, Transport and Logistics, and Others), and Geography
Apr 2025
Online Exam Proctoring Market
Size and Forecast (2021 - 2031), Global and Regional Share, Trend, and Growth Opportunity Analysis Report Coverage: By Type (Advanced Automated Proctoring, Recorded Proctoring, and Live Online Proctoring), Deployment (Cloud and On-Premises), End User (Educational Institutes, Enterprises, Government, and Online Learning Platforms), and Geography
Apr 2025
Data Center Colocation Market
Size and Forecast (2021 - 2031), Global and Regional Share, Trend, and Growth Opportunity Analysis Report Coverage: By Type (Retail Colocation, Wholesale Colocation, and Hybrid Cloud-based Colocation), Enterprise Size (Large Enterprises and SMEs), Industry Vertical (IT and Telecom, BFSI, Healthcare, Retail, and Others), and Region (North America, Europe, Asia Pacific, Middle East and Africa, and South and Central America)
Apr 2025
Personality Assessment Solution Market
Size and Forecast (2021 - 2031), Global and Regional Share, Trend, and Growth Opportunity Analysis Report Coverage: By Component (Solution and Services), Delivery Model (In-House and Outsourced), Offering (Synchronous and Asynchronous), End-user (Corporate or Enterprise [BFSI, Hospitality, IT and Telecom, Media and Entertainment, Healthcare and Pharmaceutical, and Others]), Academic or Education and Government), and Geography